Archive for the ‘Other’ Category

Recovering UML diagrams from binaries using RTTI – Inheritance as partially ordered sets

Friday, January 21st, 2011

Wow, it’s been a while since we last blogged. Ok, time to kick off 2011 🙂

A lot of excellent stuff has been written about Microsoft’s RTTI format — from the ISS presentations a few years back to igorsk’s excellent OpenRCE articles. In the meantime, RTTI information has “spread” in real-world binaries as most projects are now built on compilers that default-enable RTTI information. This means that for vulnerability development, it is rare to not have RTTI information nowadays; most C++ applications come with full RTTI info.

So what does this mean for the reverse engineer ? Simply speaking, a lot — the above-mentioned articles already describe how a lot of information about the inheritance hierarchy can be parsed out of the binary structures generated by Visual C++ — and there are some pretty generic scripts to do so, too.

This blog article is about a slightly different question:

How can we recover full UML-style inheritance diagrams from executables by parsing the RTTI information ?

To answer the question, let’s review what the Visual C++ RTTI information provides us with:

  1. The ability to locate all vftables for classes in the executable
  2. The mangled names of all classes in the executable
  3. For each class, the list of classes that this class can be legitimately upcast to (e.g. the set of classes “above” this class in the inheritance diagram)
  4. The offsets of the vftables in the relevant classes

This is a good amount of information. Of specific interest is (3) — the list of classes that are “above” the class in question in the inheritance diagram. Coming from a mathy/CSy background, it becomes obvious quickly that (3) gives us a “partial order”: For two given classes A and B, either A ≤ B holds (e.g. A is inherits from B), or the two classes are incomparable (e.g. they are not part of the same inheritance hierarchy). This relationship is transitive (if A inherits from B, and B inherits from C, A also inherits from C) and antisymmetric (if A inherits from B and B inherits from A, A = B). This means that we are talking about a partially ordered set (POSet)

Now, why is this useful ? Aside from the amusing notion that “oh, hey, inheritance relationships are POSets“, it also provides us with a simple and clear path to generate readable and pretty diagrams: We simply calculate the inheritance relation from the binary and then create a Hasse Diagram from it — in essence by removing all transitive edges. The result of this is a pretty graph of all classes in an executable, their names, and their inheritance hierarchy. It’s almost like generating documentation from code 🙂

Anyhow, below are the results of the example run on AcroForm.API, the forms plugin to Acrobat Reader:

The full inheritance diagram of all classes in AcroForm


A more interactive (and fully zoomable) version of this diagram can also be viewed by clicking here.

For those of you that would like to generate their own diagrams, you will need the following tools:

Enjoy ! 🙂

Dumping shellcode with Pin

Wednesday, July 28th, 2010

About six weeks ago, when I blogged about the Adobe Reader/Flash 0-day that was making the rounds back then, I talked about generating automated shellcode dumps with Pin. In this post I want to talk a bit about Pin, dynamic binary instrumentation, and the shellcode dumper Pintool we developed at zynamics.

Dynamic binary instrumentation is a technique for analyzing binary files by executing the files and injecting analysis code into the binary file at runtime. This method is not exactly new. It has been in use for many years already, for example in program verification, profiling, and compiler optimization. However, despite its amazing power and ease of use, dynamic binary instrumentation is still not widely used by binary code reverse engineers.

The two most important dynamic binary instrumentation tools for binary code reverse engineers are Pin and DynamoRIO. Pin is developed by Intel and provided by the University of Virginia while DynamoRIO is a collaboration between Hewlett-Packard and MIT. Both are free to use but only DynamoRIO is open source.

In general, both Pin and DynamoRIO are very similar to use. If you want to use either tool you have to write a C or C++ plugin that contains your analysis code. This code is then injected into the target process by Pin or DynamoRIO. For most reverse engineering purposes, Pin and DynamoRIO are both equally useful and when you talk to reverse engineers who make use of dynamic binary instrumentation it often seems to be a matter of personal taste which tool they prefer. At zynamics we use Pin because the API for analysis code seems cleaner to us.

Let’s get back to shellcode dumping now. The idea behind shellcode detection is rather simple: Whenever an instruction is executed, check if that instruction belongs to a section of a loaded module in the address space of the target process. If that’s the case, then the instruction is considered legit (not shellcode). If, however, the instruction is outside of any module section, and therefore most likely on the stack or allocated heap memory, the instruction is considered shellcode. This heuristic is not perfect, of course. However, it works surprisingly well in practice.

In fact, the Pintool we developed does exactly this. For every executed instruction in the target process it performs the check described in the above paragraph. Until shellcode is found, the Pintool keeps track of up to 100 legit instructions executed before the shellcode. Then, when shellcode is found, it dumps the legit instructions before the shellcode and the shellcode itself. The big value of our Pintool is not that it dumps the shellcode. The big value is that it tells you exactly where control flow is transferred from the legit code to the shellcode. With this information you can quickly find the vulnerability in the exploited program. If you are really interested in the shellcode, you can also just set a breakpoint on the last legit instruction before the shellcode and do a manual analysis from there.

You can find the complete documented source of our shellcode dumper Pintool on the zynamics GitHub. The source code is surprisingly short and I did my best to document the code. If you are having any questions about the source code, please leave a comment to this blog entry or contact me in some other way.

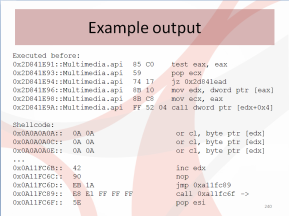
Let’s take a look at the output of a sample run now. You can find the full trace log on GitHub but here are the important parts.

What you always want to look for is the string “Executed before”. These are the legit instructions before control flow is transferred to the shellcode. Ignore the first occurence of this string. I have not had a deeper look what code is recognized as shellcode there, but it might be JIT-compiled Adobe Reader JavaScript code (which also does not belong to any section of any module and is therefore detected as shellcode). The second occurence of the string is what you want to look at.

[sourcecode]Executed before
0x238C038E::EScript.api  E8 D2 72 F6 FF  call 0x23827665
0x238BBF4F::EScript.api  8B 44 24 04     mov eax, dword ptr [esp+0x4]
0x238BBF53::EScript.api  C6 40 FF 01     mov byte ptr [eax-0x1], 0x1

[ … more EScript.api instructions … ]

0x2D841E82::Multimedia.api  56           push esi
0x2D841E83::Multimedia.api  8B 74 24 08  mov esi, dword ptr [esp+0x8]
0x2D841E87::Multimedia.api  85 F6        test esi, esi
0x2D841E89::Multimedia.api  74 22        jz 0x2d841ead
0x2D841E8B::Multimedia.api  56           push esi

[ … more Multimedia.api instructions … ]

0x2D841E96::Multimedia.api  8B 10        mov edx, dword ptr [eax]
0x2D841E98::Multimedia.api  8B C8        mov ecx, eax
0x2D841E9A::Multimedia.api  FF 52 04     call dword ptr [edx+0x4]

Shellcode:
0x0A0A0A0A::  0A 0A                      or cl, byte ptr [edx]
0x0A0A0A0C::  0A 0A                      or cl, byte ptr [edx]
0x0A0A0A0E::  0A 0A                      or cl, byte ptr [edx]

[ … more shellcode … ][/sourcecode]

The log clearly shows that control flow is transferred from EScript.api (the Adobe Reader JavaScript engine) to Multimedia.api (the Adobe Reader multimedia library) and then to shellcode which does not lie in any module section. You can even see that the exploit code controls the memory address of [edx + 0x4] in the last executed instruction of Multimedia.api. With this knowledge you can work back from this point to see what exactly the vulnerability is that was exploited. In the example, the vulnerability was the use-after-free media.newPlayer vulnerability of older Adobe Reader versions. This vulnerability uses JavaScript code to trigger a bug in the Multimedia API.

In case you are wondering about gaps in the instruction trace (for example at calls), please note that each instruction is only dumped once. So, if a function is called twice, the second call is not dumped to the output file anymore. This behavior was added to keep log files small.

I think the shellcode dumper is a good example for a first Pintool. The idea behind it is really simple and the actual Pintool can be improved by interested readers many ways (dump register values or improve the shellcode detection heuristic, for example). If you are making improvements to the tool, please let us know.

ReCon slides – "Packer Genetics: The Selfish Code" & Bochs+Python

Friday, July 16th, 2010

A few days ago Jose and Ero presented in ReCon some of the latest ideas they have been working on regarding unpacking. We have put our slides up for your viewing pleasure here:

[slideshare id=4757587&doc=recon2010-100714205302-phpapp01]

Our slides are also available for download here. Beware that they are merely a visual aid to our live presentation. We will try to remember to announce when the ReCon video comes out so you can follow them there.

In addition, Jose will be presenting on the topic in SysCan Taipei on August 20th. That will be another good chance to catch the info fresh and live.

Bochs and Python

Bochs and our custom Python extensions were one of the fundamental tools onto which we built our research.

Ero has been keeping the Python extensions up to date for a few years and they are something we use a lot at zynamics. We have attempted to make them public in a few occasions (an old patch is available in the Bochs mailing list) but those attempts failed to make them known to more users. We are frequently reminded at conferences that people would love to play with them, so this time we are making them available through a zynamics GitHub project. The plan is to keep them in sync with all major releases of Bochs. In the GitHub page you can find basic instructions on how to get them working. The patch to apply to the current public version of Bochs (2.4.5 at this time) can be found here

We will add usage examples to the GitHub wiki as time allows. Also if there are special requests we will try to provide exemples on how to use the extensions for those cases. Download them, play with them and let us know your thoughts.

A brief analysis of a malicious PDF file which exploits this week's Flash 0-day

Wednesday, June 9th, 2010

I spent the last two days with a friend of mine, Frank Boldewin of reconstructer.org, analyzing the Adobe Reader/Flash 0-day that’s being exploited in the wild this week.   We had received a sample of a malicious PDF file which exploits the still unpatched vulnerability (MD5: 721601bdbec57cb103a9717eeef0bfca) and it turned out more interesting than we had expected. Here is what we found:

Part I: The PDF file

The PDF file itself is rather large. Analyzing the file with PDF Dissector, I found two interesting streams inside the PDF file. Later I will describe that there is actually a third interesting stream, belonging to object 17, in the PDF file. This stream contains an encrypted EXE file which will be dropped and executed by the shellcode. This can not be known before analyzing the shellcode though.

The first interesting stream can be found in PDF object 1. It is a binary stream that starts with the three characters CWS, the magic value of compressed Flash SWF files headers. I dumped this stream to a file and it turned out to be a valid Flash file.
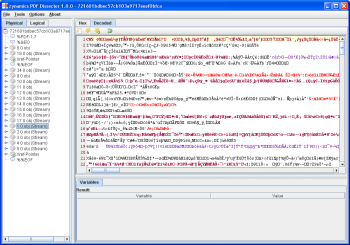
The second interesting stream belongs to PDF object 10. This stream contains a very short JavaScript code snippet that heap-sprays a huge array onto the heap. In the screenshot below you can see the original code.
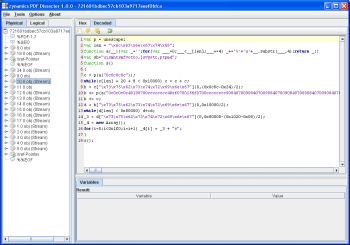
I then used PDF Dissector to execute the JavaScript code. The byte array that gets heap-sprayed is stored in the variable _3 after execution. I dumped this byte array to a file (see heapspray.bin in the ZIP file at the end of this post) and disassembled it with IDA Pro.

Later it will become clear that the embedded SWF file is actually exploiting the Flash player and not Adobe Reader (or rather it exploits the Flash player DLL that is shipped with Adobe Reader). The purpose of the PDF file is primarily to massage the heap into a predictable state for the Flash player exploit.

Part II: The shellcode – Stage I

In the disassembled file I expected to see a nop-sled followed by regular x86 code but this is not what I found. There is something that looks like a huge nop-sled (a long list of ‘or al, 0Ch’ instructions) but no valid code follows that nop-sled (which will later turn out not to be a nop-sled at all). Rather, following the ‘nop-sled’ I found a list of addresses that point into code of an Adobe Reader DLL called BIB.DLL. We were dealing with return-oriented shellcode here.

You can find the documented IDB of the shellcode in the ZIP file at the end of this post. For now please click on this link for a text file that contains the documented code. The beginning looks like

[code]
seg000:00000BEC     dd 7004919h             ; pop ecx
seg000:00000BEC                             ; pop ecx
seg000:00000BEC                             ; mov dword ptr [eax+0Ch], 1
seg000:00000BEC                             ; pop esi
seg000:00000BEC                             ; pop ebx
seg000:00000BEC                             ; retn
seg000:00000BF0     dd 0CCCCCCCCh           ; ecx = 0xCCCCCCCC
seg000:00000BF4     dd 70048EFh             ; ecx = 0x070048EF
seg000:00000BF8     dd 700156Fh             ; esi = 0x0700156F
seg000:00000BFC     dd 0CCCCCCCCh           ; ebx = 0xCCCCCCCC
seg000:00000C00     dd 7009084h             ; retn
seg000:00000C04     dd 7009084h             ; retn
[/code]

and continues for quite a while. The first column shows the address. The second column shows the values on the stack (primarily addresses to ROP gadgets in BIB.DLL). The third column shows what instructions can be found at the given addresses in BIB.DLL and what effects the shellcode has.

The ROP shellcode is a variant of the code found in this exploit POC by villy. At first, the shellcode allocates memory using NtAllocateVirtualMemory (accessed through sysenter). Then, it copies a second stage shellcode to the allocated memory and executes it.

BIB.DLL is actually a DLL file that gets randomly relocated if you have address-space layout randomization enabled on your system. Systems with enabled ASLR can not be exploited by this malicious PDF file. This does not mean that the vulnerability can not be exploited if ASLR is enabled, it’s just that the particular sample we looked at will not work in that case.

Part III: The shellcode – Stage II

The second stage shellcode is rather short. All it does is to copy the third stage shellcode to the memory allocated by the first stage. Afterwards the third stage is executed. An IDB file for the second stage is included in the ZIP file at the end of this post.

[code]seg000:00000000  pop     edx
seg000:00000001  nop
seg000:00000002  push    esp
seg000:00000003  nop
seg000:00000004  pop     edx
seg000:00000005  jmp     short loc_1C
seg000:00000007
seg000:00000007 loc_7:
seg000:00000007  pop     eax
seg000:00000008
seg000:00000008 In this loop of the second stage of
the shellcode, the third stage of the shellcode
seg000:00000008 is copied to a known address (memory allocated
by the first ROP stage) and executed afterwards.
seg000:00000008
seg000:00000008 CopyLoop:
seg000:00000008  mov     ebx, [edx]
seg000:0000000A  mov     [eax], ebx
seg000:0000000C  add     eax, 4
seg000:0000000F  add     edx, 4
seg000:00000012  cmp     ebx, 0C0C0C0Ch  ; Search for this signature to stop copying.
seg000:00000018  jnz     short CopyLoop
seg000:0000001A  jmp     short CopyTarget
seg000:0000001C
seg000:0000001C loc_1C:
seg000:0000001C  call    loc_7
seg000:00000021
seg000:00000021 After the copy loop is complete, the third stage of the shellcode begins here.
seg000:00000021
seg000:00000021 CopyTarget:
seg000:00000021  nop
[/code]

Part IV: The shellcode – Stage III

The third stage is larger again. First, it resolves a bunch of Windows API functions through name hashes. Then, it tries to figure out which open file handle points to the malicious PDF file itself. This is done by estimating the file size of the malicious PDF file and by scanning potential candidate files for two characteristic signatures. If the malicious PDF file is found, a section of the PDF file (the third interesting stream I mentioned above) is decrypted using a simple XOR decryption and then written to the file C:\-.exe. This file is then executed.

Since the third stage is part of the heap-sprayed data you can actually find the third stage code in the IDB file of the ROP stage.  The third stage code begins right after the ROP stage ends. If you want to check out the code of the third stage right now, please click on this link to see the text dump.

Part V: The dropped file -.exe

Inside the ZIP package at the end of this post you can find the commented IDB file of -.exe. Once again, this file is rather simple. Here is what it does:

  • It checks whether the current user is an administrator account.
  • If it’s not, download http://210.211.31.214/img/xslu.exe and execute it. Then shut down -.exe.
  • If it is, it extracts a file called C:\windows\EventSystem.dll and a file called C:\windows\system32\es.ini from its own resource section.
  • The BITS service (Background Intelligent Transfer Service) is shut down.
  • Windows file protection is disabled.
  • The original qmgr.dll file is moved to kernel64.dll
  • EventSystem.dll replaces the original C:\windows\system32\qmgr.dll, C:\windows\system32\dllcache\qmgr.dll and c:\windows\servicepackfiles\i386\qmgr.dll
  • qmgr.dll, EventSystem.dll, and es.ini get the timestamp of the original qmgr.dll
  • The BITS service is started again, now with the dropped qmgr.dll instead of the original qmgr.dll

If you want to check out the code right now, you can click on this link to see the disassembled file.

Part VI: The dropped file EventSystem.dll

The primary purpose of EventSystem.dll, the DLL file that was registered as a service by -.exe, is to collect information about the user’s system and to send it to a server controlled by the attacker. You can see a dump of what information is collected and sent in this log file.

Additionally, the EventSystem.dll file also contains code that can download new files from the internet and execute them afterwards. You can check out the IDB file in the ZIP file at the end of this post for a complete disassembly.

Part VII: Finding the vulnerability in the Flash player

The description of the shellcode is now complete, but one question remains: What is actually the vulnerability in the Flash player? Here is what we found:

The first step was to figure out when control flow is transferred from regular Flash player code to the first stage of the shellcode. At zynamics we have a Pin tool plugin we use to automatically recognize  shellcode and dump it to a file. You can find the complete trace generated by the Pin tool plugin in the ZIP file (pin_trace.txt). Here is the important part:

[code]0x0700156F::BIB.dll  8B 41 34                mov eax, dword ptr [ecx+0x34]
0x07001572::BIB.dll  FF 71 24                push dword ptr [ecx+0x24]
0x07001575::BIB.dll  FF 50 08                call dword ptr [eax+0x8]
0x070048EF::BIB.dll  94                      xchg esp, eax
0x070048F0::BIB.dll  C3                      ret
0x07004919::BIB.dll  59                      pop ecx
0x0700491A::BIB.dll  59                      pop ecx
0x0700491B::BIB.dll  C7 40 0C 01 00 00 00    mov dword ptr [eax+0xc], 0x1[/code]

At address 0x07004919 of BIB.dll, the ROP code of the first stage is executed. Two instructions before, at address 0x070048EF, the original stack of the executing thread is replaced by something controlled by the attacker.

To figure out where control flow is coming from it is possible to set a breakpoint on the XCHG instruction and take a look at the stack. The return value of the active stack frame will point to memory on the heap where you can find code. This code does not belong to any code section of any module, so where does it come from? Turns out that this code is just-in-time compiled ActionScript code that is created from the malicious SWF file inside the malicious PDF file.

To analyze exactly how control flow is transferred from the JIT-ed ActionScript code to the ROP stage of the shellcode, I have created a trace with OllyDbg that shows all instructions that are executed after the just-in-time compilation of the ActionScript code but before the ROP code. You can find the trace in the ZIP file at the end of this post (olly_trace.txt). Here are the important parts:

[code]28CDE2A0  mov eax,dword ptr ss:[ebp-44]

28CDE2C0  mov edx,dword ptr ds:[eax+10]     EAX=25966241

28CDE2C6  mov ecx,dword ptr ds:[edx+2b8]    EAX=25966241, EDX=20259384

28CDE2D5  mov dword ptr ss:[ebp-60],ecx     EAX=25966241, ECX=0C0C0C0C, EDX=00259685

28CDE2EF  mov ecx,dword ptr ss:[ebp-60]     EAX=25966241, ECX=0012F5D0, EDX=00259685

28CDE2F8  call dword ptr ds:[ecx+0c]        EAX=25966241, ECX=0C0C0C0C, EDX=00259685[/code]

The call at 28CDE2F8 goes directly to 0x0700156F in BIB.dll (see the Pin tool trace). So what is going on here? To understand these six lines of code you have to know a bit about the memory layout at address 0x25966241 (the value in EAX) and about the internals of just-in-time compiled ActionScript code.

Let’s start with the memory layout. Here is what I saw at 0x25966241 (note that the dump starts at 0x25966240).

[code]0x25966240   C8 0E 3D 30  05 00 00 20  00 00 00 00 00 00 00 00
0x25966250   78 84 93 25  20 44 90 25[/code]

Now eax (0x25966241) is used as a pointer in instruction 0x28CDE2C0. You might already notice that the pointer is not aligned at all. This is unusual. Now comes the part where you need to know about compiled ActionScript internals.

When values like integer numbers or objects are created by ActionScript scripts, pointers to these objects are created and stored. Interestingly, all ActionScript values must be 8-byte aligned because the lowest three bits of pointers to such values are used to encode type information about the values. For example, if the lowest three bits of such a pointer are 101, then the pointed-to value is a boolean value. 111 identifies a double value and so on.

So apparently what is happening in the above code is that a pointer that includes type information is used as a regular pointer without stripping the type information first. If you debug this piece of code and manually clear the lowest three bits to remove the type information, the value 25966241 turns into 25966240 (which itself contains a pointer to a v-table of a class called ScriptObject, lending more credence to the theory I am exploring here). So, when [eax+10] is read without stripping the type information, the pointer 0x20259384 is read. This pointer points to the binary data that was heap-sprayed by the JavaScript code of the PDF file. If you do strip the type information though, you get the pointer 0x25938478 which is a legitimate pointer to another part of the just-in-time compiled ActionScript code.

After instruction 28CDE2C0 the register EDX points to the heap-sprayed values. Most of the heap-sprayed values are 0x0C0C0C0C DWORD values, so edx+2b8 most likely points to such a DWORD value and 0x0C0C0C0C is moved into register ECX. Through some clever heap-spraying, one iteration of the heap-sprayed data actually starts at address 0x0C0C0C0C so the memory layout starting from 0x0C0C0C0C is controlled by the attacker. He then controls the value of [ecx+0c], the address of the function to be executed next.

If you go back to the JavaScript code in the malicious PDF file now, you can see the value 156f0700 close to the beginning of the heap-sprayed string. This is just the value 0x0700156F which is the entry point to the attacker-controlled control-flow in BIB.dll (see the Pin trace above again).

We know now how control flow is transferred from the just-in-time compiled code to the shellcode. The question that remains is why does the JIT-compiler produce code that leads to incorrect pointer usage?

There are two possible options here. The first one is that the JIT-compiler has a bug and emits wrong x86 code, code that forgets to strip off the type information. I don’t think this is the case because the emitted code that leads to the control-flow hijack is generated in benign cases too. I think it is far more likely that the compiler assumes pre-conditions about the generated code that are not true in this particular situation. In all of the benign cases I have observed, the type information was stripped from the pointer before the JIT code was even executed. In the malicious case this does not happen which leads me to believe that the compiler emits code that assumes that all input pointers to that code segment have been stripped of their type information but apparently this is not always the case.

Let’s look at what could trip up the JIT compiler.

Part VII: The malformed Flash file

Using the SWFTools disassembler we had a look at the Flash file that was embedded in the PDF file. It quickly turned out (by looking at characteristic strings) that the Flash file is a modified version of AES-PHP.swf from http://flashdynamix.com/. Disassembling and comparing the original SWF file to the malicious PDF file generated just a single difference.

[code]00206) + 0:1 getlex <q>[protected]fl.controls:LabelButton::icon</q>
00207) + 1:1 getlex <q>[public]::Math</q>
00208) + 2:1 getlocal_2
00209) + 3:1 getlex <q>[public]fl.controls::ButtonLabelPlacement</q>
00210) + 4:1 getproperty <q>[public]::BOTTOM</q>
00211) + 4:1 ifne ->218[/code]

[code]00206) + 0:1 getlex <q>[protected]fl.controls:LabelButton::icon</q>
00207) + 1:1 getlex <q>[public]::Math</q>
00208) + 2:1 getlocal_2
00209) + 3:1 getlex <q>[public]fl.controls::ButtonLabelPlacement</q>
00210) + 4:1 newfunction [method 000001ba ]
00211) + 5:1 ifne ->218[/code]

The only difference can be found in line 210. While the benign Flash file tries to access the property BOTTOM, the malicious Flash file tries to create a new function object. This simple change messes up the internal ActionScript stack (as can be seen in the differing stack depth numbers after the +) because getproperty and newfunction have different effects on the ActionScript stack. Subsequent ActionScript instructions then assume a stack layout which is simply wrong. Nevertheless, the JIT compiler seems to accept this code and generates x86 code for it. The consequence of this change seems to be that preconditions for JIT-compiled code that were previously true do not hold anymore and the attacker can control the control flow as seen above.

Part VIII: The end

Now it would be interesting to figure out exactly what trips up the JIT code generation to see how it gets into this situation. I think we are going to wait for the patch for this and just use BinDiff to compare the patched version of the Flash player with the unpatched version. 🙂

You can get the malicious PDF file and all the IDB files and traces we generated from this ZIP file. We have also submitted -.exe to CWSandbox. You can see the generated report about the file’s activity here.

Oh yeah, the malicious PDF file is in the ZIP package too. Pay some attention there and don’t backdoor yourself accidentaly. The password to the ZIP file is ‘infected’.

Objective-C phun on Mac OS X

Tuesday, June 8th, 2010

A few posts ago Jose showed a script to clean-up ARM iPhone binaries.The x86 counterparts suffer from the same problems, so I thought it would have been useful to have something similar for it.Both the behaviour and the algorithm behind the script are pretty much the same as the one Jose wrote.
The real difference is in the “dumbish” dataflow tracing method we use. In fact the calling convention on Iphone and OS X is different; so instead of tracing register assignments we have to trace stack variables and of course we are on x86. We currently don’t track function arguments and complex operands. Of course, it can be improved, but it still yields good results as it is:)

Another problem you sometimes encounter when analyzing OSX binaries is that sections are not interpreted correctly. For this purpose I wrote a very simple script that cleans up an OSX binary IDB.Basically it will aggressively make functions in the __text segment and make sure that __cstring is effectively interpreted as a segment containing strings and not code.
You can find both scripts on our company github repository.

If you want to learn a bit more about OS X hacking and reversing consider taking the
class
I and Dino Dai Zovi are going to teach at Black Hat USA.

zynamics PDF malware analysis training now available

Friday, May 28th, 2010

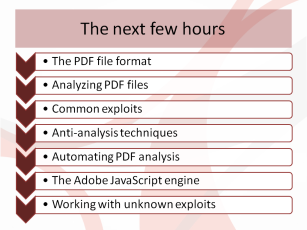
We are proud to announce that we have added a new training about PDF malware analysis to the list of trainings we offer. This new training focuses on everything you need to know when you are dealing with PDF malware. Participants will learn about the following topics:

  • Useful tools for PDF analysis
  • The physical and logical structure of PDF files
  • An explanation of the most commonly exploited vulnerabilities of the last years
  • The many ways malicious code can be executed from PDF files
  • Common obfuscation techniques used by malware to slow down analysis
  • Automation of PDF analysis if you are dealing with many samples
  • Acrobat Reader internals
  • How to use RTTI, BinDiff, and other means to restore some thousand function names in the Adobe Reader JavaScript engine disassembly
  • Automated extraction of shellcode using dynamic instrumentation

If your organization or company would like to know more about the training, please contact info@zynamics.com.

Here are a few sample slides from the trainings material.

Training overview

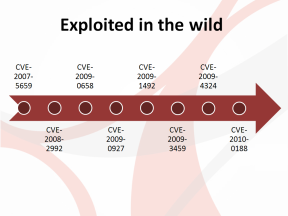
Exploited in the Wild

Automated extraction of shellcode using dynamic instrumentation

Guest lecture: Architectural Diversity

Friday, May 21st, 2010

At zynamics we believe that good education is something we have to support. Therefore Sebastian and I decided to support Professor Felix Freiling and his two assistants Carsten Willems and Ralf Hund in their class called Software Reverse Engineering at the University of Mannheim, Germany. Sebastian held a lecture about Windows debugger internals and their use in reverse engineering which you can read about here. This week it was my turn to share some knowledge about architectural diversity in reverse engineering.

While architecture diversity is nothing new, still most people think that only x86 and x64 are interesting to look at because of their desktop computer market share. In my lecture I wanted to show that the range of interesting targets is far broader than generally believed. I started the lecture with a cherry picked set of architectures which are quite common in different usage scenarios. These architectures have some interesting differences between them to motivate a need for a more general reverse engineering approach. Even though a variety of general reverse engineering approaches exist I focused on our own approach, the REIL meta language. I gave a short introduction to the features of REIL and a language definition with an emphasis on its simplicity. After presenting small translation examples which show how REIL translation works I started with REIL use case examples. Prior to presenting and demoing register tracking as a simple use case, a very informal description about the underlying MonoREIL framework was presented. MonoREIL is an abstract interpretation framework which ships with BinNavi to assist an analyst in writing algorithms to answer questions about program states using a formally described method. Demoing register tracking and explaining how it works on top of MonoREIL rounded up the lecture.

I was asked to hold an exercise covering all topics of the lecture after presenting which worked out pretty well. I enjoyed being invited to give a lecture in Mannheim and I greatly admire the work which has been put into the lecture in general. If more Universities offered a reverse engineering class it would be a great plus for a lot of students.

The slides which I used for lecturing are in German and available here:

[slideshare id=4202172&doc=sre20100517-100521081907-phpapp02]

Ten years of innovation in reverse engineering

Monday, May 17th, 2010

On our way back home from Black Hat Europe in Barcelona, Thomas and I were brainstorming about the most important changes to the field of binary code reverse engineering in the last 10 years. What has changed since then? What made the biggest impact? Remember: Back in the dark days of 2000, W32Dasm and Turbo Debugger were considered good reverse engineering tools. If you had a self-written tracer that logged the execution of conditional jumps you were basically a king.

Anyway, we came up with several trends and technologies we believe have changed the job of reverse engineers tremendously since 2000. Here they are:

Visual flow graphs for assembly code

First introduced in IDA Pro 4.17 (June 2001), the ability to view disassembled assembly code in graph form made the job of reverse engineers much easier. In essence, using visual flow graphs during reverse engineering raises the level of abstraction and understanding of code while at the same time lowering the required time and effort one has to invest. Before we had graphs we had to reconstruct control-flow structures like loops and if-else statements from linearly listed assembly instructions. With visual flow graphs we can just look at the graph and understand the control flow pretty much immediately.

In the following years other tools (such as BinNavi) were built around the idea of interacting with flowgraphs. Shortly thereafter, the graph engine of IDA Pro was improved (especially in IDA Pro 5.0, March 2006) to provide interactive graphing out of the box.

Python as a scripting language

Back in 2000, most reverse engineering tools were primitive and barely extensible. For disassemblers your best bet was a clumsy IDC implementation in IDA Pro 4. For debuggers the situation looked even bleaker. This all changed with the growing popularity of the scripting language Python and SWIG, a technology which allows programs to easily add a Python interpreter and expose a Python-based API. The first major step forward I can remember was the creation of the IDAPython plugin for IDA Pro which added a way to access the IDA API from Python (Gergely Erdelyi, 2004). Later we had tools like Pedram Amini’s PyDbg or Ero Carrera’s pefile that helped popularize the Python language in reverse engineering.

Today, Python is the de-facto scripting language of reverse engineering and many tools from IDA Pro to ImmunityDebugger or BinNavi support Python scripting.

Dynamic Instrumentation

Even though the technology is not brand-new (the first publications describing ‘Dynamo’ go back to 2000), the widespread use of dynamic instrumentation tools like DynamoRIO and Pin for reverse engineering certainly is. Using these frameworks you can build very powerful dynamic analysis tools that allow the monitoring and manipulation of instruction streams in a very transparent and highly efficient way. If you have never used either of these tools, you can imagine them like a way to efficiently receive a callback to a C/C++ program after every instruction. Using these, you can directly control every aspect of the targeted program, while incurring small overhead.

If you are looking for a new reverse engineering tool to do some research with, dynamic instrumentation might be for you: Working on actual program traces removes a lot of complication in comparison to the static case, and the many different productive uses of dynamic instrumentation are still far from exhausted. While relatively fresh and untapped, dynamic instrumentation tools are definitely a topic people talk about at IT security conferences and elsewhere.

BinDiff-ing

Many years ago, some smart people had a brilliant idea: If you compare an unpatched version of a file to a patched version of the same file, you can easily find what code was changed by the patch and use this information to quickly find vulnerabilities that were patched by the patch. Soon it became evident that new tools were needed that make the process of comparing two versions of the same file as quick and easy as possible. Our own BinDiff tool is maybe the most popular diffing engine for binary code today. However, the idea of comparing files is so popular that a number of free competitors have sprung up over the years. In general, these tools all work in the same way: Once the two input files are disassembled, the functions in file A are matched to the functions in file B and local changes to the matched functions are found and shown to the user.

BinDiff-style tools are now part of the standard toolbox of many reverse engineers, from vulnerability researchers to malware analysts and there is hardly another technology that rose as spectacularly as this one since 2000.

The end of SoftICE

Back in the days there was just one debugger everybody used for reverse engineering: SoftICE. SoftICE was a wonderful debugger originally written by a company called NuMega from New Hampshire. It was a debugger that allowed you to debug user-land programs as well as kernel-land programs on your blog.zynamics.com machine without the need for any complicated setup. Later, NuMega was bought by Compuware and SoftICE was discontinued in April 2006.

Of course, newer debuggers have replaced SoftICE today. Microsoft’s own WinDbg, while not nearly as pretty as SoftICE, is the new powerful and popular debugger on the block.

The arrival of the Hex-Rays decompiler

Back in 2000, decompilers sucked. Today, there is Hex-Rays. Back in 2007 the team behind IDA Pro released the first decompiler I am aware of that is actually useful. Since then they have continued to improve the decompiler and they are already showcasing support for ARM decompilation.

While not many people seem to use Hex-Rays yet, this product is definitely one to keep an eye on.

Collaborative Reverse Engineering

Back in 2000, collaborative reverse engineering was unheard of as it was really difficult to exchange reverse engineered information between two databases created by the same program, let alone between different programs. In recent years the situation changed a bit, probably mostly out of necessity. Software today is much more complex than it was ten years ago and very often teams of reverse engineers have to collaborate on the same project.

While still in their infancy, collaborative reverse engineering tools are here to stay and will probably become even more popular in the future. Reverse engineers will pick tools like Chris Eagle’s CollabREate for IDA Pro or our own BinCrowd to share their results with friends and colleagues.

Academic Approaches

Another trend of the last few years is that major universities research topics related to binary code reverse engineering. Among others, there are the University of Berkeley and Carnegie Mellon University which have done really impressive work in the last few years. At the same time, reverse engineers in the industry have begun to take note of academic approaches to reverse engineering. While academic approaches to reverse engineering are not yet in common use in the industry, we know many people and companies that are beginning to look into more formalized ways to reverse engineering. The popularity of the Reverse Engineering Reddit, maybe the primary resource for formalized reverse engineering on the internet, speaks volumes.

So, that’s our opinion. Maybe your opinion is different. Do you disagree with any of those advances or did we miss anything significant? Can you think of any technology that was supposed to be the future but then bombed spectacularly in practice? Let us know. 🙂

Product updates: BinCrowd, PDF Tool, MSDN parser

Tuesday, May 11th, 2010

Hi everyone,

we have a few interesting updates for three of our products:

BinCrowd (Collaborative reverse engineering tool; more info here)

The login bug that plagued early testers of our free BinCrowd community server should be fixed now. If you had problems logging in to your account in the past, please try again now. Note that clicking on the confirmation link in the original confirmation email was buggy too. It is possible that your account was deleted automatically because it was not confirmed within 7 days. In that case just make a new account.

We have also improved the speed of file comparisons in the web interface a lot. Even large files like Adobe Reader’s acrord32.dll are now compared to all files in the database in just a few seconds.This is absolutely amazing if you want to compare your file to different versions of the same file, for example to figure out what changed.

Another improvement was made to the BinCrowd IDA Pro plugin which you can get from the zynamics GitHub account. It can now handle the upload of larger files more gracefully. Previous versions tended to crash when giants files (roughly >50K functions) were uploaded.

PDF Tool (Malware PDF analysis tool; more info here)

Our malware PDF analysis tool without a name still has no name. However, we would like to release the first version of it really soon and that’s why we need a name. If you know a name for the tool, please let us know through comments to this post. If we name the tool after your suggestion you will get a free life-long single-user license of the PDF tool.

MSDN Parser (IDA Pro plugin for importing MSDN documentation, more info here)

Thanks to Navtej Singh, Mario Vilas, and others it was possible to improve the IDA Pro plugin that imports MSDN information into IDA Pro. Parsing of the MSDN documentation was improved and function argument names/descriptions are now copied from MSDN into IDB files. That means you now have full documentation about the function arguments of Windows API functions in your IDB files.

At zynamics, we like good offense …

Friday, May 7th, 2010

… and therefore we are happy to have sponsored Shawn Dean so he could go to the Wajutsu Keishukai Grappling Tournament in Tokyo – which HE WON.  We are happy to have had to opportunity to sponsor him and even happier to see him succeed.

Also, it is great to see BinNavi-embroidered shorts on the winner 😛

Watch it yourself here:

Shawn Dean receives honors