Archive for January, 2010

Black Hat DC preview

Wednesday, January 27th, 2010

On February 3rd I will be speaking at Black Hat DC. The talk is about fuzzing. Today Microsoft has its SDL, Abobe has apparently started fuzzing its own products and other companies are doing the same as well. The bottom line is that fuzzing is getting harder for us. In the talk I will explain how to create a new type of fuzzer by combining static analysis metrics and dynamic analysis techniques. This new approach will ease the process of fuzzing by totally removing the data-modeling part that is usually necessary with generation-based fuzzers. At the same time it will have better results than mutation-based fuzzers. I have written about some of the techniques/metrics used in the fuzzer in my previous blog posts. So to have a taste of the talk here are a few links: cyclomatic complexityloop detection and code coverage.

Anyway if you happen to be in DC during Black Hat or in NYC a few days after (4 -7 February) and you want to talk with me about:

  1. Reverse engineering and the like : you have a problem that’s driving you crazy, you can solve one of those problems for me or you want to show me something very cool you are working on.
  2. Our products: you want more info, you know how to improve them, you want  to congratulate me because they are *so* cool
  3. You feel generous and want to offer me a beer
  4. You want to insult me because this blog post is *very* annoying

Send me an email!

After the conference I will do a follow-up post with slides, white paper, code and what you have missed at the conference.

Cheers,

Vincenzo

Code coverage and BinNavi

Sunday, January 24th, 2010

I have already explained in my previous posts how much I love static analysis, nonetheless sometimes you have to get your hands dirty and use a debugger. In this post we will take a look at the BinNavi debugging APIs and how to use them to create a code coverage plugin. In this blog post I have spoken about how to use BinNavi “without BinNavi” so in order to fully understand the rest of the post it is probably better to take a look at it.

We implement code coverage at basic blocks level, that is we set a breakpoint at the beginning of each basic block inside a module. So the first thing to do is to retrieve the basic blocks of a given module. BinNavi exports a method to directly read the start address of each basic block belonging to a given module from the database instead of iterating through the functions and retrieve the basic blocks structures. It should be noticed though that this method cannot be used to modify basic blocks structures.

[sourcecode language=”python”]
for module in mods:
addresses = ModuleHelpers.getBasicBlockAddresses(module)
for address in addresses:
addr = address.toLong()
# filter them using user-supplied lower and upper bound addresses
if start_addr <= addr <= end_addr:
blocks.append(addr)

print "Total basic blocks", len(blocks)[/sourcecode]

Of course those addresses need to be relocated at run-time,  therefore the next task is to locate the module in-memory and relocate each address accordingly. Intuitively in order to do so we need to attach to the remote process and look for loaded modules until we find the one we are interested in:

[sourcecode language=”python”]
def getRunningModule(self, moduleName):

if self.debugger is None:
return None

self.debugger.process.addListener(self)
self.name = moduleName

if self.debugger.isConnected() is False:
print "attaching to the remote target"
self.debugger.connect()

while self.module is None:
continue

self.debugger.suspend()[/sourcecode]

We suspend the target process here because before executing the process we first need to relocate the addresses and set breakpoints. We will resume it after both operations are completed.

As you might have noticed before attaching to the remote target we register a listener for the target process.
There are a few types of listener classes useful for our purposes, most notably IDebuggerListener and IProcessListener. Both of them are notified when common debugging events happen. To learn more about those listeners  I suggest you to take a look at the documentation.
In our class we implement a few methods of the IProcessListener class which are called by the dispatcher inside BinNavi when certain messages are delivered from the remote debugger.

[sourcecode language=”python”]
def changedTargetInformation(self, process):
self.debugger.resume()

def addedModule(self, process, mod):
if self.module != None:
return
for module in process.modules:
if module.name.find(self.name) != -1:
self.module = module[/sourcecode]

The first method is called when the debugger attaches to the target process and retrieves some basic information on it. We need to resume the process at that point as the debugger after the initialization suspends it(notice that the call to suspend() in the previous code snippet happens after we locate the module in memory, that is after we call resume() here).

The second method is called whenever a new image is loaded in the process address space. In our code as soon as we find the module we are looking for we don’t care about other images.

Now that we have the module in-memory we can relocate the addresses:

[sourcecode languge=”python”]
inMemoryAddr = runningModule.baseAddress.toLong()
originBaseAddr = self.naviDB.module.imagebase.toLong()
print "Original Base Address: %x In-Memory one: %x\n Relocating..\n" % (inMemoryAddr, originBaseAddr)
for bb in self.blocks:
addresses.append((bb – originBaseAddr) + inMemoryAddr)[/sourcecode]

I lied when I said we need to set breakpoints, in fact BinNavi takes care of that internally by the means of a TraceLogger!

[sourcecode language=”python”]
for address in addresses:
naviAddresses.append(TracePoint(self.traceEntity, Address(address)))

print "Starting the process…\n"
tracer = TraceLogger(self.debugger, self.traceEntity)
self.traceManager = myTraceListener(addresses)
self.trace = tracer.start("codeCoverage", "", naviAddresses)
self.trace.addListener(self.traceManager)
self.debugger.resume()[/sourcecode]

TraceLogger is a class which let create a log of echo breakpoint events, that is we create a list of TracePoints (locations where the trace logger sets echo breakpoints) and the TraceLogger will take care of the rest.

Echo breakpoints are a ‘lightweight’ version of regular breakpoints. In essence, echo breakpoints get removed after they are initially hit. This leads to better performance of the application that is being debugged, as execution speed of a particular path is only slowed down during the -first- execution.

So first we set up the tracer and then we create the trace. A trace can have a listener which is notified when a new event is added; we use such a listener to keep track of the blocks touched during the execution.

[sourcecode language=”python”]
class myTraceListener(ITraceListener):
def __init__(self, addresses):
self.addyCount = []
for address in addresses:
self.addyCount.append((address, 0))

def addedEvent(self, trace, event):
for addy, counter in self.addyCount:
if addy == event.address:
self.addyCount.remove((addy, counter))
self.addyCount.append((addy, counter + 1))[/sourcecode]

When a new event is added, we retrieve the address and update the address counter accordingly.
At this point we are all set, and we can get the code coverage score:

[sourcecode language=”python”]
def getCodeCoverage(self):
#get the list of all the executed blocks at a given program point
touched_blocks = self.naviTracer.getExecBlocks()
coverage = float(len(touched_blocks)) / float(len(self.getBlocks()))
return coverage

def printStatistics(self):
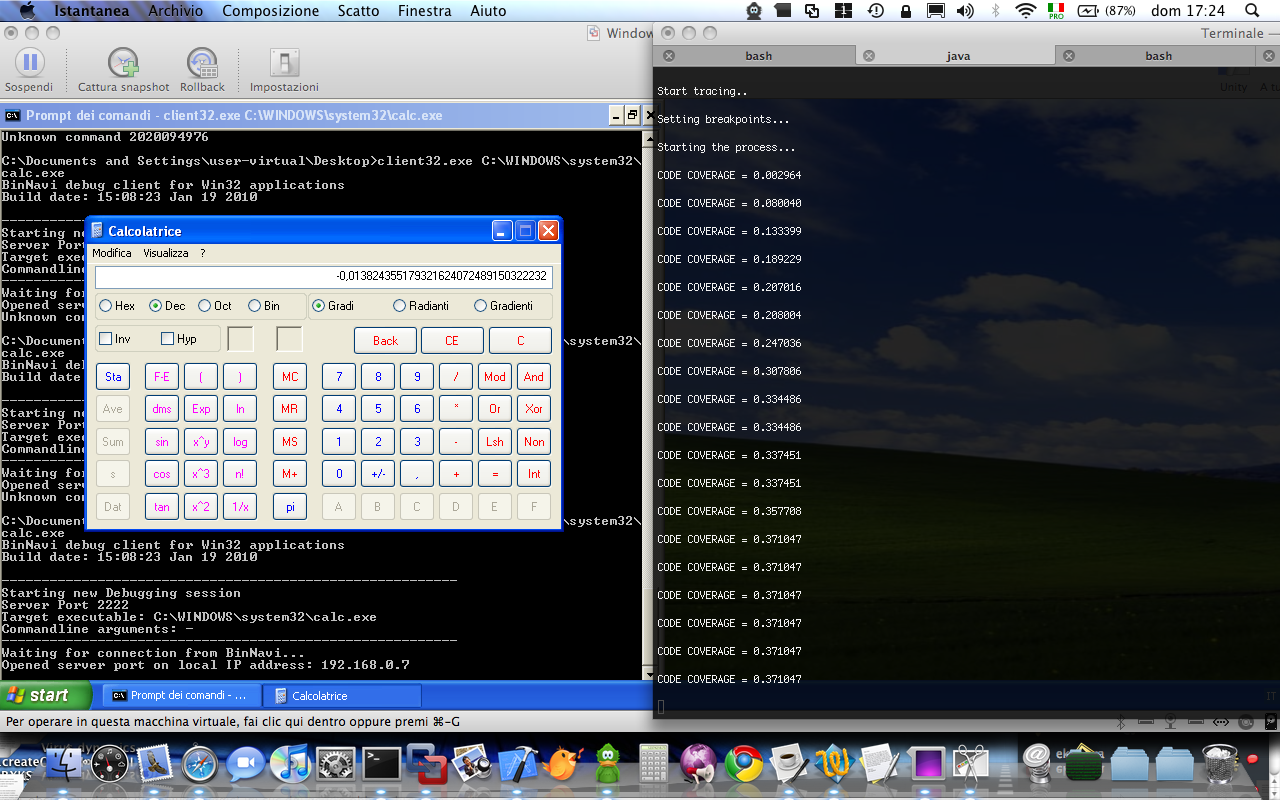
print "CODE COVERAGE = %f\n" % self.getCodeCoverage()
[/sourcecode]

Let’s run it then! On the target machine we run:

[code]
client32.exe C:\WINDOWS\system32\calc.exe
[/code]

on the local machine

[code]
jython NaviCoverage.py databaseHost databaseUser databasePassword databaseName calc.exe
[/code]

And here’s a screenshot
That’s all for now.

Guest lecture on Formal Methods in Reverse Engineering

Thursday, January 21st, 2010

Last November Michael Meier of Dortmund University invited me to give a guest lecture on a topic of my choice in his class about reactive security.  The topic we decided on was formal methods in reverse engineering. January 20th was the date of my guest lecture.

I was a bit nervous because I knew the students knew very little or nothing about formal methods and reverse engineering. I decided not to scare them away with assembly code or heavy math and to keep things general instead. The idea was to present current problems in reverse engineering caused by growing size and complexity of today’s software and how formal methods might be able to help us overcome these problems.

In the end I decided to give a brief introduction to abstract interpretation, meta languages, dynamic instrumentation, and taint tracking as four potential ways of cutting down on complexity which are all quite different.

I think the talk went rather well and I think I made the right decision with the topic. The students asked me some good questions during and after the talk and I like to believe that I did not bore them to death.

The slides of my guest lecture are available here although they are unfortunately in German language.

[slideshare id=3002487&doc=revengdortmund-100127054621-phpapp01]

BinNavi 3.0 Preview: Improved Differential Debugging

Tuesday, January 19th, 2010

One of the most popular features of BinNavi is what we call Differential Debugging.  Differential Debugging is the ability to create trace logs of debugged processes and to analyze these logs later.  Although BinNavi has had this feature since version 1.5, the functionality of Differential Debugging was rather limited and remained almost unimproved for the last two years. All it did so far was to record the addresses of the instructions executed during a trace. For BinNavi 3.0 we have improved Differential Debugging significantly.

Data Recording

The first improvement we made is to log more information about the state of the debugged program. For each executed instruction, BinNavi 3.0 is not only recording the address of the instruction but the values of all CPU registers when that instruction was executed. If any of the registers point to valid memory, up to 128 bytes starting from where the register is pointing to are recorded too. All of this information is stored in the database and can later be analyzed by the user.

Recording register values and memory chunks is useful but it quickly became clear that even small trace logs contain a lot of data that can easily overwhelm the user. To make the data more accessible to the user we added ways to search through lists of trace events. It is possible to display only those trace events that contain registers of a given value or only those trace events whose memory chunks contain a given byte sequence. This is very useful to quickly find exactly those trace events that access critical data.

Switching Traces

The next improvement we made is to give the user the option to create a new trace record while the debugger is already in trace mode. In the past it was only possible to start trace mode for a given graph and to turn it off again later. In BinNavi 3.0 it is possible to switch the trace log which receives recorded events on the fly. This is very useful in any situation where you want to discard all trace events before a given moment or to sort trace events into different trace logs.

Imagine you want to record how an instant messenger program sends a message. You can start the instant messenger program and begin to record a trace. At first, all the breakpoints of the random background noise (like GUI handlers) are hit. These events are not important and go into the first log which is later discarded. Once all unimportant breakpoints have been hit you can tell BinNavi to put all further trace events into a new trace log. Then you can send an IM message. The trace events triggered by the message sending code are all put into the second list. To find the code that processes a received message you can do the same again. Tell BinNavi to put all trace events that arrive from now on into a new trace list, then send a message to your IM client.

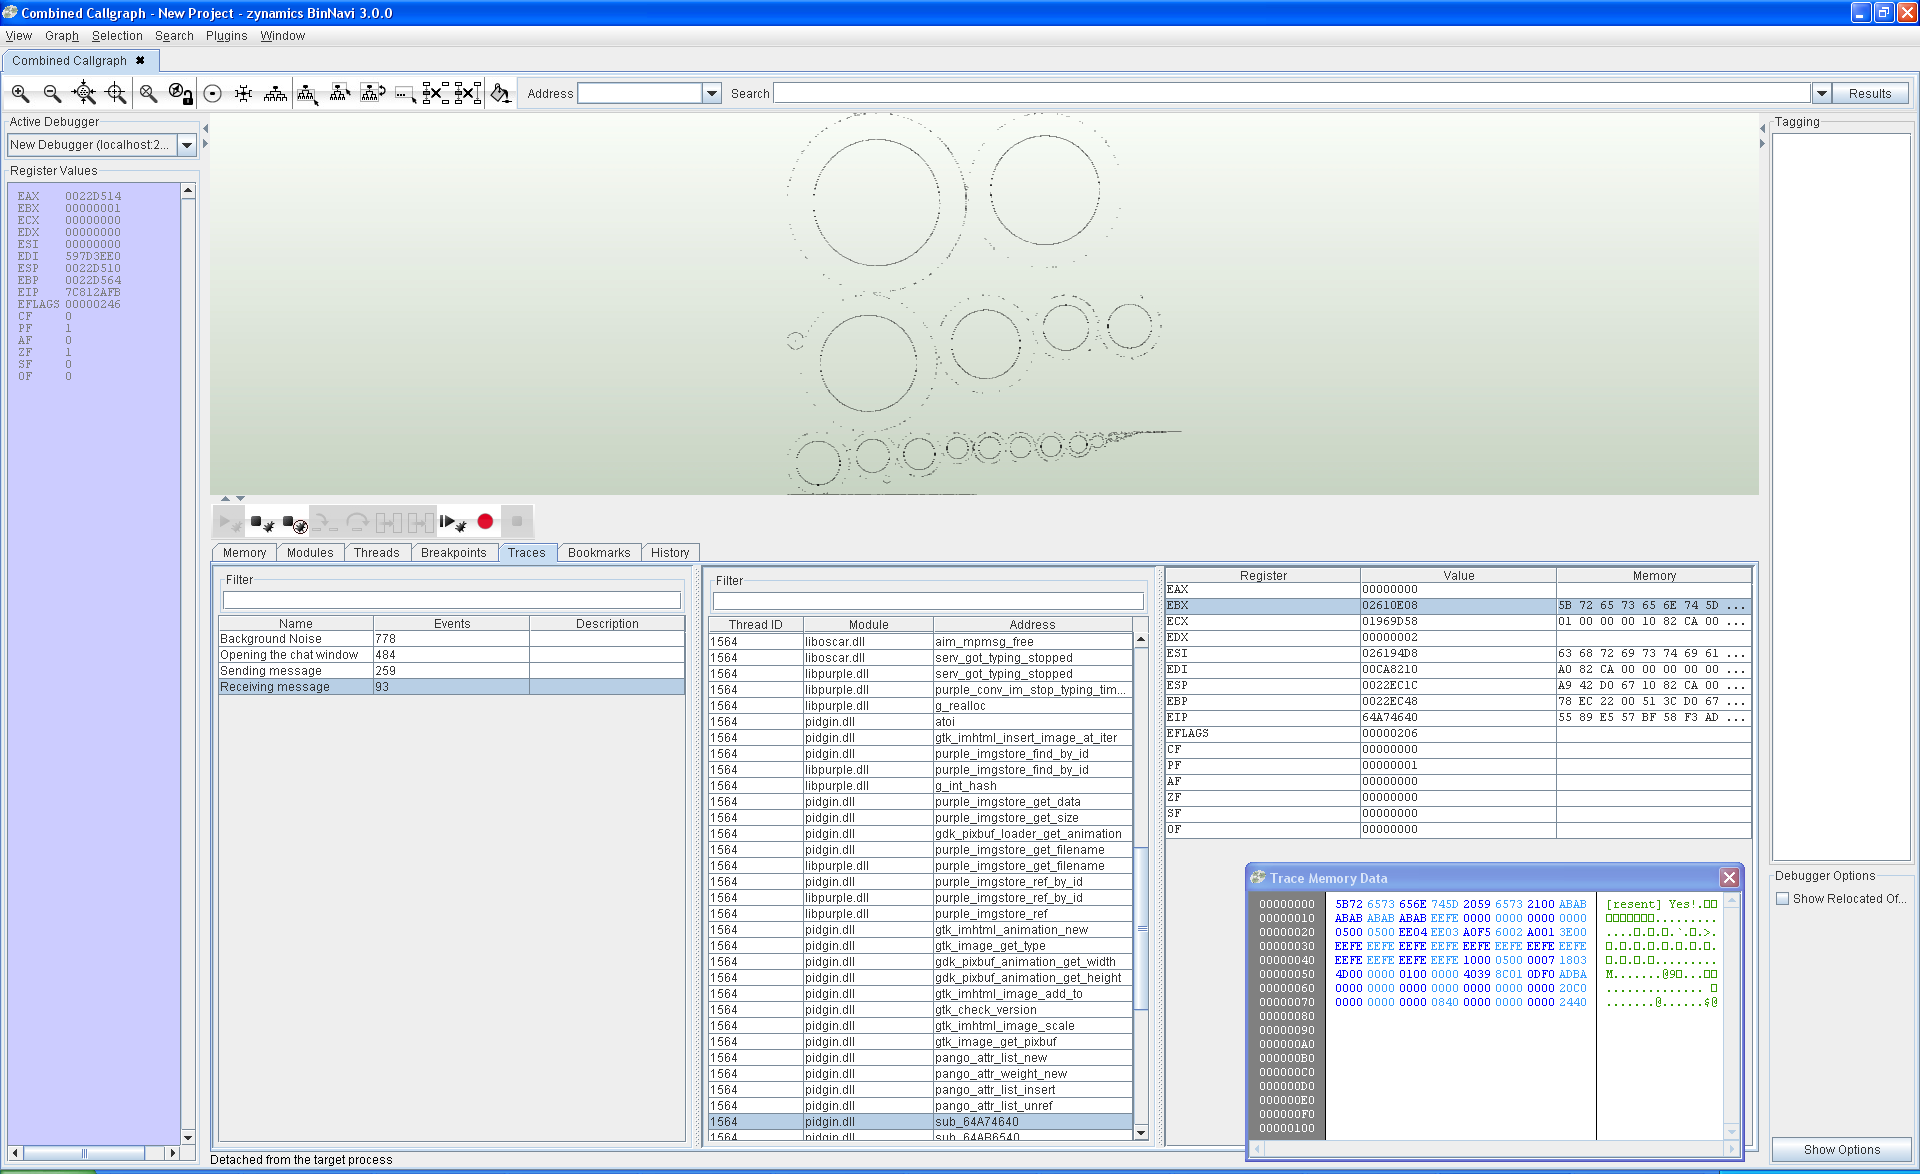
The result of all of this is shown in the following screenshot which shows the results of a Pidgin debugging session. What I did to produce these trace logs was to start Pidgin and switch the attached debugger to trace mode. The first trace log (Background Noise) contains all the breakpoint events that were triggered immediately or when I did unrelated things like move my mouse over the Pidgin window. Once the background noise events stopped I spawned off a new trace (Opening the chat window) and opened a chat window. This second trace contains only those events that were triggered while the chat window was opened. Then I spawned off another  trace (Sending message) and sent a message to someone. Afterwards I waited for an incoming chat message from the person I was chatting with.

BinNavi 3.0 trace mode demonstration

Differential Debugging of Pidgin message sending

In the end I had four neatly separated trace logs which contain trace events for exactly those functions that are responsible for opening a chat window (second log), for sending a message (third log), and for receiving a message (fourth log).

Combining Trace Logs

While the ability to sort trace events into different trace logs on the fly is incredibly useful, it is not really useful in situations where the user does not know when exactly to create a new log. To make it more comfortable to find pieces of code in these situations, we have added the option to combine recorded traces. It is now possible to combine previously recorded traces using set-union, set-intersection, and set-difference operations.

Especially the set-difference operation is very useful in practice. Imagine you have a program that accepts input and performs a sanity check on the input. Now you can simply record a trace of a program execution where you give the program well-formed input and another trace where you give the program malformed input. Doing a set-difference on the two recorded traces shows you exactly where the program traces deviate and you can easily find the part of the code that checks whether the input was wellformed or not.

The last improvement we made to Differential Debugging is to give the user the option to configure how often trace events at individual addresses are recorded. In the past, each address was only recorded once. This was useful to get a quick overview of the executed code but in other situations this was simply not good enough. We have had users who wanted to generate more complex trace logs that record trace events every time an instruction is executed. This is useful if you want to profile code for speed or if you want to do code coverage that considers how often an instruction is executed. Using Differential Debugging in BinNavi 3.0 this is now possible.

That’s it for Differential Debugging in BinNavi 3.0. These improvements should make it much easier for users to find exactly those parts of a debugged program they are looking for.

Introducing: The official zynamics blog! :-)

Monday, January 18th, 2010

Dear Readers (and fellow reverse engineers),

welcome to the shiny new zynamics blog!

Over the last several years, most of the zynamics crew has kept their own (personal) blogs, and frequently, topics that were of interest to the reverse engineer were scattered over several different blogs. It was not unusual to have to search through my blog, Ero’s blog, SP’s blog, or Vincenzo’s blog on the quest to finding a particular piece of information.

Also, at least one of those blogs was updated only sporadically (primarily … mine), and intermingled heavily with non-technical rants on the state of the world or the quality of the food in some random pub.

This situation was clearly untenable — and we therefore decided to pool all our reverse-engineering (and zynamics)-related stuff in one place.

On this blog, you will find posts regarding the following topics:

  • General reverse engineering
  • Bug hunting
  • Interesting uses of BinNavi / BinDiff
  • Automated malware classification / signature generation
  • Other things that I can’t think of yet, but that will certainly crop up in due time

So, enjoy the posts, and tell a friend!

Cheers,

Halvar