Archive for the ‘BinNavi’ Category

How to config the Win32 Kernel Debugger

Thursday, February 24th, 2011

As mentioned here, one of the new features of the upcoming BinNavi 3.1 release, is the Win32 kernel debugger. This debugger enables you to perform dynamic analysis of Win32 kernel components. In this blog post I will describe how to configure your work environment to use the new debugger for BinNavi.
To debug kernel components with BinNavi, it is necessary to have a host system which runs BinNavi with the kernel debugger and a virtual machine which runs the code you want to analyse.
There are two ways for connecting your debugging system with the debugger. The first one is to use Virtual KD, which is the fastest solution, and the second one is to use the more generic, but slower WinDBG named pipe method.
It is recommended to use a virtual machine in combination with Virtual KD. Although other configurations are possible, they should only be chosen if Virtual KD can’t be used.

Configuration with Virtual KD

For this you need to install Virtual KD on the host system and on the guest vm, which will be used for debugging. After you downloaded the package and copied the target/vminstall.exe to your vm, you install Virtual KD by running the executable. Press the install button after checking if the parameters match the ones in the screenshot.

Now you can start the virtual machine monitor vmmon.exe (included in Virtual KD) on the host system and restart the debug virtual machine. The virtual machine monitor shows the pipename which is automatically created by the virtual monitor and is later used by the kernel debugger.

Configuration without Virtual KD

An alternative method is to use the standard com port via named pipes method in combination with vmware or a physical machine.

In case of using vmware, you need to go the settings of your virtual machine and add a new hardware. Choose as hardware ‘serial port’ with the name as ‘\\.\pipe\com_1’ and as additional options ‘This end is the server’ and ‘The other end is an application’.

Now you can start the virtual machine and edit the boot option to run the virtual machine with the debug option. These settings depend on your operating system:

For Windows XP:

You have to edit the boot.ini file of your virtual machine. For this you have to append the following line to your configuration file: ‘/debug /debugport=com1/baudrate=115200’.

If you want to do debug a physical machine you may want to change this parameter to suit your needs.

multi(0)disk(0)rdisk(0)partition(1)\WINDOWS="normal boot" /noexecute=optin /fastdetect
multi(0)disk(0)rdisk(0)partition(1)\WINDOWS="debug boot" /noexecute=optin /fastdetect /debug /debugport=com1 /baudrate=115200

You must reboot your vm for the changes to take effect.

For Windows Vista and Windows 7:

You have to use the bcedit command to change the boot option:

At first start a cmd shell with admin privileges, then use the following command to get the ID

bcdedit /v

then make a copy of the normal entry:

bcdedit /copy {ID} /d "kernel debug"

and enable kernel debug on it with the following command:

bcdedit /debug {ID} on

You must reboot your vm for the changes to take effect. For more information please have a look at
http://www.microsoft.com/whdc/driver/tips/Debug_Vista.mspx

Configuration in BinNavi

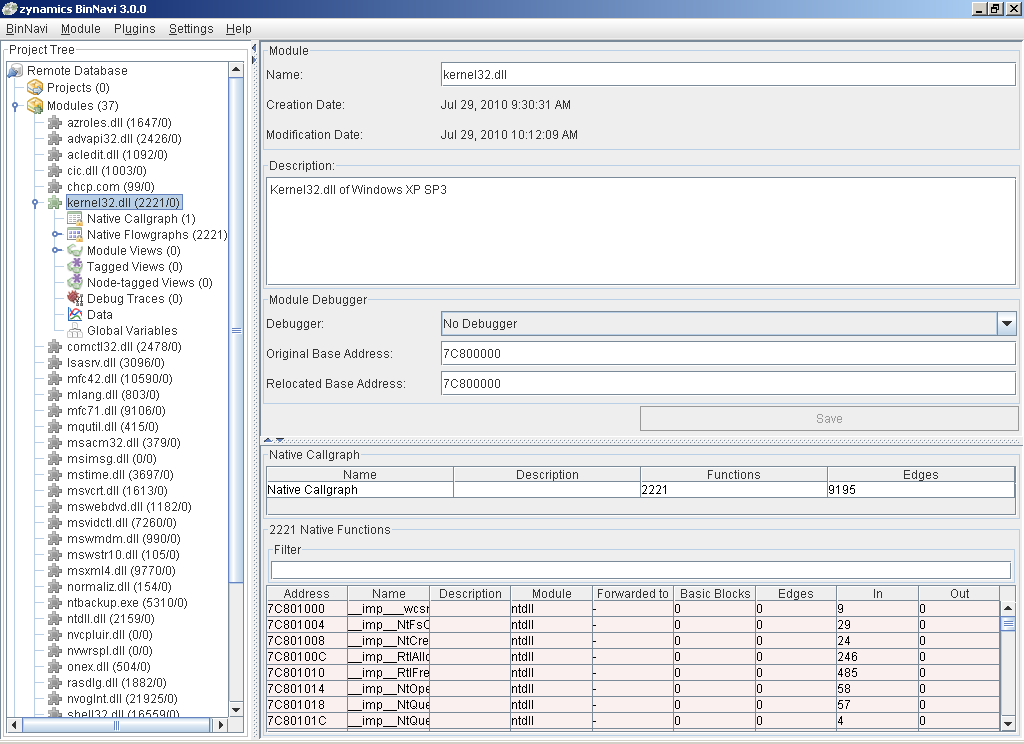
The next step is to load your device driver using the usual step into the BinNavi database. This procedure is explained in more detail here. After the module is successfully loaded, you have to create a new debugger and assign it to the module. The default port is 2222 which can be changed. After this is done you can run the windbg debug client using the command line:

windbgclient32.exe -p 2222 com:port=\\.\pipe\kd_WindowsXPSP2,baud=115200,pipe

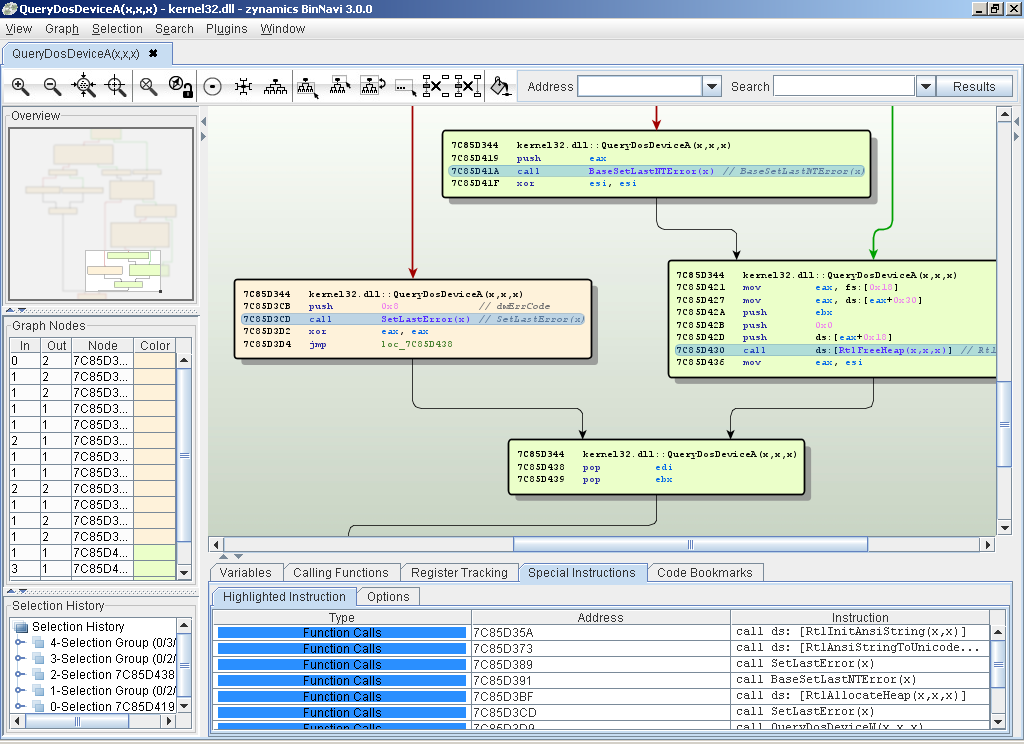
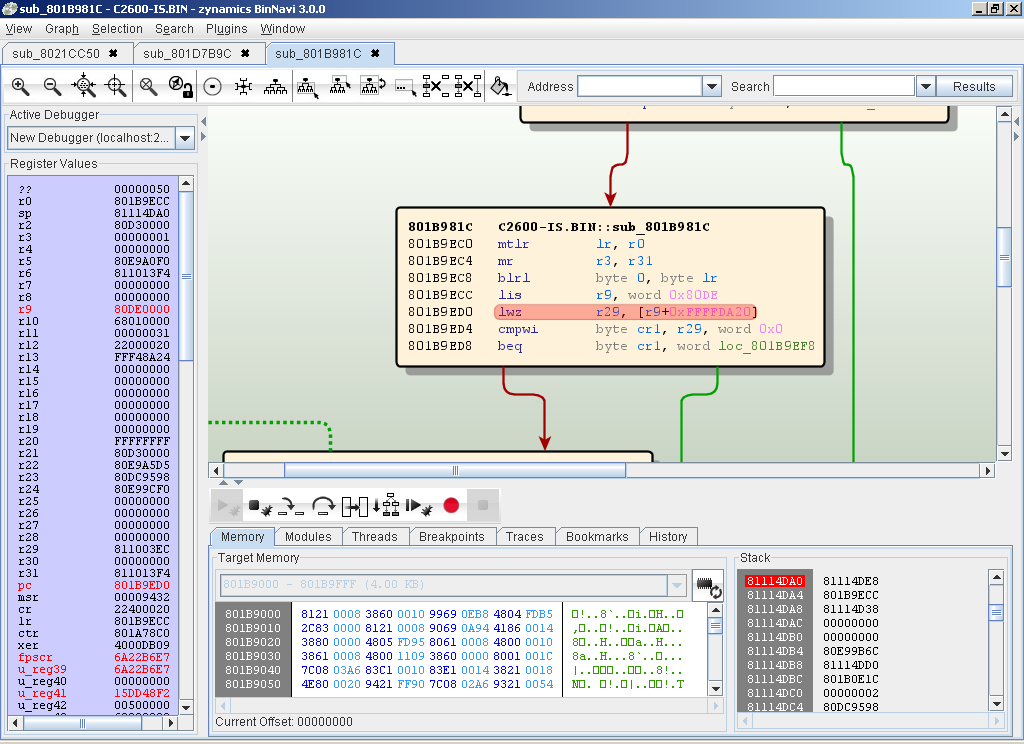
This results in listening on the default debug port and connecting to the name pipe ‘kd_WindowsXPSP2’. Now you can open the module in BinNavi by selecting a call graph or flow graph and switch to the debug view (crtl+d). To connect to the selected debugger just press the start debugger button and wait until the debugger is loaded. In the last step you have to choose the right device driver you want to debug in the dialog.

After all steps are done you can start with your normal work flow to analyse the module. This includes using the trace mode for differential debugging and setting breakpoints on interesting functions.
Happy debugging!

Recovering UML diagrams from binaries using RTTI – Inheritance as partially ordered sets

Friday, January 21st, 2011

Wow, it’s been a while since we last blogged. Ok, time to kick off 2011 🙂

A lot of excellent stuff has been written about Microsoft’s RTTI format — from the ISS presentations a few years back to igorsk’s excellent OpenRCE articles. In the meantime, RTTI information has “spread” in real-world binaries as most projects are now built on compilers that default-enable RTTI information. This means that for vulnerability development, it is rare to not have RTTI information nowadays; most C++ applications come with full RTTI info.

So what does this mean for the reverse engineer ? Simply speaking, a lot — the above-mentioned articles already describe how a lot of information about the inheritance hierarchy can be parsed out of the binary structures generated by Visual C++ — and there are some pretty generic scripts to do so, too.

This blog article is about a slightly different question:

How can we recover full UML-style inheritance diagrams from executables by parsing the RTTI information ?

To answer the question, let’s review what the Visual C++ RTTI information provides us with:

  1. The ability to locate all vftables for classes in the executable
  2. The mangled names of all classes in the executable
  3. For each class, the list of classes that this class can be legitimately upcast to (e.g. the set of classes “above” this class in the inheritance diagram)
  4. The offsets of the vftables in the relevant classes

This is a good amount of information. Of specific interest is (3) — the list of classes that are “above” the class in question in the inheritance diagram. Coming from a mathy/CSy background, it becomes obvious quickly that (3) gives us a “partial order”: For two given classes A and B, either A ≤ B holds (e.g. A is inherits from B), or the two classes are incomparable (e.g. they are not part of the same inheritance hierarchy). This relationship is transitive (if A inherits from B, and B inherits from C, A also inherits from C) and antisymmetric (if A inherits from B and B inherits from A, A = B). This means that we are talking about a partially ordered set (POSet)

Now, why is this useful ? Aside from the amusing notion that “oh, hey, inheritance relationships are POSets“, it also provides us with a simple and clear path to generate readable and pretty diagrams: We simply calculate the inheritance relation from the binary and then create a Hasse Diagram from it — in essence by removing all transitive edges. The result of this is a pretty graph of all classes in an executable, their names, and their inheritance hierarchy. It’s almost like generating documentation from code 🙂

Anyhow, below are the results of the example run on AcroForm.API, the forms plugin to Acrobat Reader:

The full inheritance diagram of all classes in AcroForm


A more interactive (and fully zoomable) version of this diagram can also be viewed by clicking here.

For those of you that would like to generate their own diagrams, you will need the following tools:

Enjoy ! 🙂

The REIL language – Part IV

Tuesday, August 24th, 2010

In the first three parts of this series I covered different aspects of our Reverse Engineering Intermediate Language REIL. First, I gave a short overview of REIL and what we are trying to achieve with it. Then, I talked about the REIL language itself. Finally, I talked about the REIL translators that turn native assembly code into REIL code. In this fourth part of the series I want to talk about MonoREIL.

MonoREIL is an abstract interpretation framework based on REIL. We have added this framework to BinNavi to help our customers build their own static binary code analysis algorithms. Since MonoREIL provides a standard implementation of an abstract interpretation algorithm, users of MonoREIL only have to implement a few interfaces that define implementation-specific aspects of their custom analysis algorithm.

MonoREIL algorithms operate on so-called instruction graphs. These graphs represent the REIL code you want to analyze. Each node of the graph represents a single REIL instruction. The edges between nodes represent potential control flow transfers between REIL instructions. This graph structure is provided by the MonoREIL framework itself so you do not have to create this graph yourself.

What you have to do is to specify the order in which the instruction graph will be traversed. Some algorithms are easier to implement starting at the entry node of a function and working towards the exit node. Others benefit from starting at the exit node and walking backwards.

If you want to implement an abstract interpretation algorithm yourself, you have to think about the abstract program state you want to model. Imagine you want to track whether a register influences other registers further down the control flow. In this case, your abstract program state would be a set of influenced registers.

In the first step of your algorithm you assign concrete instances of this abstract program state to each node of the instruction graph. These initial program states reflect prior knowledge you already have about the program before the analysis algorithm is run. For the register tracking algorithm you probably do not have any prior knowledge beyond what register you want to track. The instruction graph node where register tracking begins is initialized with the set the contains just the register you want to track. All other nodes are assigned the empty set.

Tracking EAX: Start (green), use (blue), overwritten (red)

Now MonoREIL begins to traverse the graph in the direction you have specified earlier. For each node it encounters on the way, the input abstract program state and the REIL instruction in the node are used to determine the output abstract program state for the node. This transformation is completely dependent on your concrete analysis algorithm and you have to implement the so-called transformation function yourself. For example, if  the register tracking algorithm is tracking the register set {eax} and comes across the instruction “add eax, 5, ebx”, the transformation function generates the output set {eax, ebx} because from this instruction on, both the registers eax and ebx depend on eax in some way. If the next instruction is “xor ecx, ecx, eax”, the input set {eax, ebx} is changed to {ebx} because the xor instruction sets eax to a value that does not depend on any of the input registers. After the xor instruction, eax does not depend in any way on the tracked registers and can be removed from the register set.

This is where the reduced instruction set of REIL really begins to shine. Since there are only 17 different instructions, you have to implement at most 17 different transformation functions that turn the input abstract program state of a node into an output abstract program state. In practice, you will have to implement far fewer transformation functions because most algorithms can handle transformations for multiple instructions uniformly (just think about register tracking and the add, sub, mul, div instructions).

The transformation functions are sufficient to do abstract interpretation along a single control flow path. However, they can not be used when multiple control flow paths converge into a single control flow path. To handle this special case, all MonoREIL algorithms have to implement a function that can take an arbitrary number of abstract program states and merge them into a single program state. If the register tracking algorithm receives the set {eax} from one path and the set {ebx} from another path, the input set of the node where these control flow paths merge is the union of the two input sets {eax, ebx}. In the node where the two control flow paths merge, both registers are tainted.

That’s pretty much what you have to do to implement your own code analysis algorithm. There are a few minor implementation details you have to consider to make sure that your MonoREIL algorithm terminates and returns the right result. For example, you have to make sure that your abstract program states never lose previously gained information. If they do, it would be possible to lose information in one step and regain it in the next step, leading to infinite loops where information is constantly lost and regained. This monotonous property of abstract program states is what gave MonoREIL its name.

Once you have defined all of the mentioned interfaces, you can tell MonoREIL to run your analysis algorithm. MonoREIL traverses the instruction graph and applies abstract program state transformations along the control flow path. This process continues until no new information about the program state can be discovered. For each node of the instruction graph, MonoREIL then returns the final abstract program state for the node. This information is the result of the analysis algorithm and can further be interpreted and displayed in the GUI by your custom analysis code.

If you want to know more about MonoREIL you can check out the slides of our CanSecWest 2009 presentation Platform-independent static binary code analysis using a meta-assembly language where we implemented a MonoREIL algorithm to detect array access operations with negative array indices. MonoREIL is also mentioned in the slide sets Applications of the reverse engineering language REIL, Automated static deobfuscation in the context of Reverse Engineering, and The Reverse Engineering Language REIL and its Applications.

BinNavi 3.0 released

Monday, August 2nd, 2010

We are proud to announce that BinNavi 3.0, the latest version of our graph-based reverse engineering tool, was released today. Previous versions of BinNavi have already helped reverse engineers in the IT security industry, in governmental agencies, and academia around the world do their jobs faster and better. The new version of BinNavi will definitely by very welcomed by existing and new customers because it is a huge improvement compared to BinNavi 2.2.

I have already talked about the most important new features in a previous blog post when the first beta of BinNavi 3.0 was announced. For example, I mentioned the improved exporter that is used to get information from IDA Pro into BinNavi. Back then I was excited about processing about 80.000 functions per hour. Between the first beta and the final release we managed to improve this number again. For the screenshots below I exported more than 110.000 functions in just 15 minutes. This improvement alone makes me never want to use earlier versions of BinNavi again.

Let’s take a look at a few new screenshots of BinNavi 3.0.

The BinNavi main window

The general layout of the main window stayed the same. On the left-hand side you can configure databases to work with. In the screenshot you can see that I configured a database called Remote Database that contains 37 modules (disassembled files). These modules can then be loaded to browse through the disassembled code. The right-hand side of the main window changes depending on what node of the project tree you have selected. In the screenshot you can see detailed information for the module kernel32.dll.

Analyzing disassembled code

The second screenshot shows the so-called graph window where you analyze disassembled code. BinNavi always shows disassembled code as flow graphs. This makes it easier for reverse engineers to follow the control flow. In the screenshot I have changed the default color of some basic blocks and told BinNavi to highlight all function call instructions.

Debugging a Cisco 2600 router

The third screenshot shows a BinNavi debugging session. The debug target is a Cisco 2600 router. The next instruction to be executed is highlighted in the graph. On the left-hand side you can see the current register values. On the bottom you can see a dump of the RAM and the current stack.

Collecting program state in trace mode

In cases when manual debugging is not enough, you can switch to trace mode. In trace mode, breakpoints are set on all nodes of the open graph and whenever a breakpoint is hit, the current register values and a small memory snapshot are recorded. This feature is so useful for quickly isolating interesting code that you should really check out the video that demonstrates this feature.

That’s it for now. If you want to learn more about BinNavi please check out the product website and the manual. If you are having any questions please leave a comment or contact the zynamics support.

Win32 Kernel Debugging with BinNavi

Thursday, July 29th, 2010

Hi everyone,

we – that would be Andy and Felix – are student interns at zynamics in Bochum. We both study IT-Security at the University of Bochum in our 8th semester and have both been with the company for several years now.

For the last half year we have been working together on a WinDbg kernel-debugging interface for zynamics’ reverse engineering tool BinNavi. After our latest bug fixes and code improvements we now feel ready to announce that this piece of software has finally reached alpha status. It is now almost feature complete but still got some rough edges and known bugs.

What does this mean to you as a (maybe future) BinNavi customer?

You will be able to use all the advanced debugging features of BinNavi for remote Win32 driver and kernel debugging. All you need to have is a machine with BinNavi and the Microsoft Debugging Tools for Windows installed and – of course – a second Win32 (virtual) machine you want to debug. Given these prerequisites, you can directly start to explore the vast and dark realms of Win32 kernel land from an easy-to-use, nice and cozy GUI. There are probably other tools out there to do this. But only BinNavi provides you with all the powerful features of our Differential Debugging technology. Please see Sebastian’s post from a few weeks ago to understand why we are so excited to bring this technology to ring0.

To give you an idea of how kernel debugging with BinNavi looks like, we took three screenshots. The first one shows the driver selection dialog that BinNavi displays right after attaching to a target machine. The second one displays a function trace of mrxsmb.sys on an idle Windows XP machine connected to a network. The 150 functions called during our trace are enumerated in the lower mid, while the recorded register and memory values for each call are displayed in the lower right. In the third screenshot you can see us single-stepping a random function in mrxsmb.sys.

Selection of the target driver

Function trace of mrxsmb.sys on idle machine

Single-stepping mrxsmb.sys

Once we are done polishing our code, we will post here again on this site to demonstrate how this technology can facilitate the process of finding the interesting code parts in Win32 drivers. Specifically, we will use Differential Debugging to pin point the code parts that are responsible for password processing inside the driver of a certain closed-source HDD encryption product. This is interesting both for writing a password brute-forcer and for checking for implementation mistakes.

If you are an existing BinNavi costumer and want to play a bit with the current alpha version, just let us know – we will be happy to supply you with the latest build. Beside that, the final version will be shipped to all customers with one of the next BinNavi updates.

The REIL language – Part III

Monday, July 19th, 2010

In the first and second part of this series I have given an overview of our Reverse Engineering Intermediate Language (REIL) and talked about the purpose and structure of the individual REIL instructions. This third part is about REIL code generation.

REIL is included in BinNavi to help users write their own code analysis algorithms, often based on abstract interpretation. However, obviously our users are not really interested in analyzing REIL code. What they really want is to analyze the native assembly code of their target binary file. The REIL language can nevertheless be used by all users of BinNavi. The translation from native assembly code to REIL code is just as simple and transparent as porting the results of REIL analysis back to the original code.

BinNavi 3.0 ships with REIL translators for ARM, MIPS, PowerPC, and x86 code. Code from any of these native assembly languages can be translated to REIL code with the same effect on the program state as the original code. Users can then analyze the effects of the much simpler REIL code and port the results of the analysis back to the original native assembly code they are really interested in.

The translation process from native assembly code to REIL code is very simple. Given a list of native assembly instructions, each individual instruction is translated to REIL code. In a second pass, the generated linear listing of REIL code is taken and converted into a control flow graph. This control flow graph is then passed to the user and he can use it in his code analysis algorithm.

When writing the translators, we made sure that all native assembly instructions could be translated to REIL code without needing any information about the instructions before or after the current instruction. This allowed us to keep the individual instruction translators stateless.

Generally multiple REIL instructions are emitted by the translators for any native input instruction. Consequently it is not possible to keep a 1:1 mapping between the addresses of the original assembly instructions and the addresses of their corresponding REIL instructions. The solution we found was to multiply every native address by 0x100 to calculate the base address of all REIL instructions that belong to a native instruction. The lowest byte of such REIL addresses can then be filled by an index that specifies the relative position of a single REIL instruction inside the sequence of REIL instructions generated from the same native input instruction. What I mean here is that if you have a native instruction at address 0x08 the REIL translators will generate REIL instructions for it at addresses 0x800, 0x801, 0x802, …

This way of translating native instruction addresses to REIL instruction addresses limits us to at most 256 REIL instructions for each native instruction. In practice, even getting to 30 REIL instructions for one native instruction is rare although we have a few outliers that are translated to up to 70 REIL instructions.

There is another big advantage to this address translation method. For any given REIL instruction you can immediately determine its native source instruction. There is no need to consider any additional context around the REIL instruction. This is really important if you want to port the results of a REIL analysis algorithm back to the original code. If you have determined a result for a REIL instruction you can just divide its REIL address to 0x100 and you know the original instruction for which the result holds too.

Translating x86 code to REIL code

That’s it for now. If you have any questions about the translation process or REIL in general please leave a comment.

We are hiring a new BinNavi developer

Thursday, July 15th, 2010

After we have already hired Tim and Jose this year to join zynamics as full-time employees, we are now looking to extend our team once again. This time we are looking for a software developer who wants to join the BinNavi team.

BinNavi is a binary code reverse engineering tool that enables reverse engineers to analyze binary code. Customers of BinNavi are primarily vulnerability researchers from companies and governmental organizations of many different nations that try to find new 0-days in closed-source software.

Working on BinNavi means you will be working on a large application with more than 500.000 lines of code. The majority of that code is written in Java (the whole main program), a few ten-thousand lines of code are written in C++ (the debuggers and the IDA Pro plugin to get disassembly data from IDA Pro into a MySQL database). You are a good candidate if you know how to write clean code and you have a reverse engineering background that gives you an idea about what features are useful to our customers.

It is also crucial that you are self-motivated and have a clear idea of where development should be going. At zynamics, there is very little management from above. Rather, the individual teams (like the BinNavi team) decide themselves what features to prioritize next and when to schedule the next release of a project.

There are a few perks that make working for zynamics really pay off. There is the obvious one: you will work on the cutting edge of reverse engineering tool research and development. However, there are others. For example, you can attend as many IT security conferences as you want to provided you give a talk there and the organizers pay for your flight and hotel (which nearly all IT security conferences do, so just submit somewhere and be accepted to speak). There is a nearly unlimited budget for computer science books (all employees know the password to the corporate Amazon account and can buy at will). You will meet many of our customers who come from all walks of life and have amazing stories to tell.

Of course there are downsides to the job, too. The primary issue we face again and again when filling job positions is that we do not want any remote workers. You would have to move to Bochum, Germany for the job and work from our office (working from home two times a week or so is OK). Since we want to fill this position quickly (preferably you would start August 1st but no later than August 15th) we can not consider candidates that require a work permit that takes longer to process. Except for this, we welcome applications from software developers of all backgrounds.

Please note that this is not a reverse engineering job. On the job you will most likely not be doing a lot of reverse engineering beyond what is required to test BinNavi. What you can do, however, is to implement new code analysis algorithms that improve the usefulness of BinNavi to our customers.

If you are interested in this job, please send an email to info@zynamics.com to request more information. Or just send your resume and some piece of code you wrote that makes us want to hire you.

Las Vegas & the zynamics team

Wednesday, July 14th, 2010

Along with RECon, the single most important date in the reverse engineering / security research community is the annual Blackhat/DefCon event in Las Vegas. Most of our industry is there in one form or the other, and aside from the conference talks, parties and award ceremonies, there’s also a good amount of technical discussions (in bars or elsewhere) that takes place.

This year, a good number of researchers/developers from the zynamics Team will be present in Las Vegas — alphabetically, the list is:

  1. Ero Carrera
  2. Thomas Dullien/Halvar Flake
  3. Vincenzo Iozzo
  4. Tim Kornau

So, if you wish meet any of the team to discuss reverse engineering, our technologies, our research, or the performance of the Spanish or German football team at the last world cup, do not hesitate to drop an email to info@zynamics.com — Vegas is always chaotic, and scheduling a meeting will minimize stress for everyone that is involved.

Specifically, the following topics are specifically worth meeting over:

  1. Chat with Ero over our unpacking engine (just presented at RECon) — and how it fits into the larger scheme of things (e.g. VxClass)
  2. Meet with Tim or Vincenzo to discuss automated gadget-finding for ROP, or anything involving the ARM/REIL translations
  3. Meet with Thomas/Halvar to discuss VxClass, automated malware clustering, automated generation of “smart” malware signatures etc.

Aside from this, if you are interested in …

  • … boosting your reverse engineering performance by porting symbols from FOSS software into your closed-source disassemblies (BinDiff)
  • … becoming faster at finding bugs by leveraging differential debugging, the REIL intermediate language and static analysis frameworks (BinNavi)
  • … enhancing team-based reverse engineering by pooling accumulated knowledge and sharing information (BinCrowd)
  • … automatically correlating and clustering malware and forensically obtained memory dumps, and automatically deriving detection mechanisms (VxClass)
  • … analyzing malicious PDF files including the embedded JavaScript code (PDF Dissector)

then do not hesitate to drop us mail — we’ll gladly show/explain what our tools/technologies can do.

See you there !

BinNavi 3.0 Beta 2 released

Wednesday, July 7th, 2010

Today we have released the second beta of BinNavi 3.0. We are now planning to release the final version on August 1st.

The main thing we changed since the first beta version was to improve the MySQL database format to handle large files better. This became necessary as more and more of our customers try to analyze really big images, like Cisco router dumps, with BinNavi. The second major change was to add compatibility with the new IDA Pro 5.7 which is now the preferred data source for BinNavi disassembly data.  Of course we have also fixed various minor bugs that have been reported by our busy beta testers since the first beta was released.

Not many features were added since the first beta was released. You can see the most important new features of BinNavi 3 in this blog post I wrote when the first beta was released. To learn more about BinNavi please check out the manual on our website.

Screenshot of BinNavi 3.0: Highlighting all uses of the local variable Buffer

If you are already a customer of a zynamics product and you would like to get your hands on the BinNavi 3.0 beta, please send an email to support@zynamics.com.

The REIL language – Part II

Tuesday, June 22nd, 2010

In the first part of this series I gave a brief overview of the REIL language (Reverse Engineering Intermediate Language), the intermediate language we use in our internal binary code analysis algorithms. I talked about the language in general and what motivated us to create it. In this second part I am going to talk about the REIL instruction set.

As mentioned in the first part of the series, there are only 17 different REIL instructions. We deliberately decided to reduce the instruction set as much as possible without losing too much of the semantics of the original instructions. This was important for us because we primarily use REIL code in abstract interpretation algorithms and the fewer instructions an instruction set has, the less code you have to implement in your abstract interpretation algorithms. It is much easier and faster to write code that processes the effects of 17 different instructions on the program state than it is for 100 instructions.

The REIL instruction set can loosely be divided into five different groups of instructions: Arithmetic instructions, bitwise instructions, data transfer instructions, logical instructions, and other instructions.

Arithmetic instructions

With six different instructions, the group of arithmetic instructions is the biggest group. It contains the instructions ADD (Addition), SUB (Subtraction), MUL (Unsigned multiplication), DIV (Unsigned division), MOD (Unsigned modulo), and BSH (Bitwise shift). Each of these instructions takes two input operands and one output operand where the result of the operation is stored.

[sourcecode]
add eax, 5, ebx // ebx = eax + 5
sub t0, 10, t1 // t1 = t0 – 10
mul t1, 10, t2 // t2 = t1 * 10
div t1, 10, t2 // t2 = t1 / 10
mod t1, 10, t2 // t2 = t1 % 10
bsh t1, -5, t2 // t2 = t1 << 5
[/sourcecode]

ADD and SUB work just like you would expect addition and subtraction to work. The two input operands are added or subtracted and the result of the operation is stored in the output operand.

It is a bit unusual that REIL only supports unsigned multiplication and division operations but it turned out that it is simple to simulate signed multiplication and division using their unsigned counterparts.

The BSH instruction is one of the design mistakes we made in REIL 1.0. We encoded the direction of the shift (bitwise left shift or bitwise right shift) in the sign of the second operand. If the operand is negative, a left shift is executed. If it is positive, a right shift is executed. This makes the interpretation of BSH instructions very difficult especially if the shift-amount is not a constant value (think shl eax, cl on x86) We are planning to replace the BSH instruction with two instructions, LSH and RSH, in future versions of REIL.

Bitwise instructions

The second group of instructions, the bitwise instructions, contains the three instructions AND, OR, and XOR. These instructions behave just the way you expect bitwise AND, OR, and XOR to behave. Each instruction takes two input operands and connects the bits of the input operands using the truth table of the bitwise operation specified in the mnemonic. The result of the bitwise operation is stored in the output operand.

[sourcecode]
and eax, 5, ebx // ebx = eax & 5
or t0, 10, t1 // t1 = t0 | 10
xor t1, 10, t2 // t2 = t1 ^ 10
[/sourcecode]

Data transfer instructions

The third group of instructions, the data transfer instructions, is more interesting again. It contains the instructions STR, LDM, and STM.

The STR instruction (Store Register) copies an integer literal or the content of a register to another register. The source operand is the first operand of the instruction, the target operand is the third operand.

LDM (Load Memory) and STM (Store Memory) are used to access the memory of the simulated process. In the LDM instruction, the first operand specifies the memory address from where a value is loaded. The third operand is the register operand where the loaded value is stored. In the STM instruction, the order of operands is reversed. The first operand specifies the value to be written to memory, the third operand specifies the memory address.

Both LDM and STM can access memory regions of any size in one go. In case of LDM,  the size of the accessed memory equals the size of the REIL operand where the loaded value is stored. In case of STM, the size of the accessed memory equals the size of the REIL operand that contains the value to store.

[sourcecode]
str t0, , t1 // t1 = t0
ldm t0, , t1 // t1 = [t0]
stm 33, , t1 // [t1] = 33
[/sourcecode]

Logical instructions

The fourth group of instructions is the group of logical instructions. With two instructions, BISZ and JCC, this group is rather small.

The BISZ instruction (Boolean Is Zero) takes a value in the first operand and checks whether the operand is zero or not. If it is zero, the output operand of the instruction is set to one. Otherwise it is set to zero.

JCC (Jump Conditional) is the only way to execute a branch in the REIL language. The instruction takes a condition in the first operand and if the condition operand evaluates to anything but zero, control is transferred to the instruction at the address specified in the third operand.

[sourcecode]
bisz t0, , t1 // t1 = t0 == 0 ? 1 : 0
jcc t1, , t2 // jump if t1 != 0
[/sourcecode]

Other instructions

The group of other instructions contains the remaining REIL instructions that do not really fit into any other group.

The first instruction is the NOP instruction (no operation). This instruction does not have an effect on the program state. At first it seems useless to have this instruction in the REIL instruction set but it turned out that having this instruction simplifies the translation process from native assembly instructions to REIL instructions in certain edge cases. Of course, we also could have simulated NOP using the other REIL instructions.

The second instruction of this group is the UNDEF instructions. This instruction is used to indicate that a REIL register has an undefined state. The UNDEF instruction became necessary because there are x86 instructions that leave flags in an undefined state.

The third and last instruction of this group is the UNKN instruction. This instruction is a placeholder instruction that is emitted by the REIL translator every time it encounters a native assembly instruction it can not translate.

[sourcecode]
nop , , // Does nothing
undef , , eax // Marks eax as undefined
unkn , , // Translator found an unknown instruction
[/sourcecode]

A word about operands

In the example code above you have already seen that REIL operands are very simple. In fact, REIL operands can only be of three different types:

  • Integer literals: Decimal, positive integer numbers
  • Registers: String literals like t0 or eax
  • REIL addresses: Two integer literals separated by a period character (400.20)

The purpose of integer literals and register operands is the same for REIL as it is for native assembly instructions. REIL addresses are necessary because there are certain native assembly instructions that contain branches within itself (think of the x86 REP instructions). These internal branches are simulated by REIL JCC instructions with REIL addresses as the third operand. I will talk more about REIL addresses in the third part of this series.

All REIL instructions have three of those operands. However, not all instructions require all three operands to be present. Unnecessary operands have a special type ’empty’ that is not printed when you write down a REIL instruction. That’s why in the example code above you see instructions that have operands separated by commas but without any operand names between the commas. What operands are omitted depends on the functionality of the operands. We have always tried to have the first two operands act as input operands while the third operand is the output operand. The BISZ instruction, for example, has the first and third operand but not the unnecessary second input operand.

That’s it for the second part of this series. In the next part I will talk about translating native code to REIL code.