The REIL language – Part IV

August 24th, 2010

In the first three parts of this series I covered different aspects of our Reverse Engineering Intermediate Language REIL. First, I gave a short overview of REIL and what we are trying to achieve with it. Then, I talked about the REIL language itself. Finally, I talked about the REIL translators that turn native assembly code into REIL code. In this fourth part of the series I want to talk about MonoREIL.

MonoREIL is an abstract interpretation framework based on REIL. We have added this framework to BinNavi to help our customers build their own static binary code analysis algorithms. Since MonoREIL provides a standard implementation of an abstract interpretation algorithm, users of MonoREIL only have to implement a few interfaces that define implementation-specific aspects of their custom analysis algorithm.

MonoREIL algorithms operate on so-called instruction graphs. These graphs represent the REIL code you want to analyze. Each node of the graph represents a single REIL instruction. The edges between nodes represent potential control flow transfers between REIL instructions. This graph structure is provided by the MonoREIL framework itself so you do not have to create this graph yourself.

What you have to do is to specify the order in which the instruction graph will be traversed. Some algorithms are easier to implement starting at the entry node of a function and working towards the exit node. Others benefit from starting at the exit node and walking backwards.

If you want to implement an abstract interpretation algorithm yourself, you have to think about the abstract program state you want to model. Imagine you want to track whether a register influences other registers further down the control flow. In this case, your abstract program state would be a set of influenced registers.

In the first step of your algorithm you assign concrete instances of this abstract program state to each node of the instruction graph. These initial program states reflect prior knowledge you already have about the program before the analysis algorithm is run. For the register tracking algorithm you probably do not have any prior knowledge beyond what register you want to track. The instruction graph node where register tracking begins is initialized with the set the contains just the register you want to track. All other nodes are assigned the empty set.

Tracking EAX: Start (green), use (blue), overwritten (red)

Now MonoREIL begins to traverse the graph in the direction you have specified earlier. For each node it encounters on the way, the input abstract program state and the REIL instruction in the node are used to determine the output abstract program state for the node. This transformation is completely dependent on your concrete analysis algorithm and you have to implement the so-called transformation function yourself. For example, if  the register tracking algorithm is tracking the register set {eax} and comes across the instruction “add eax, 5, ebx”, the transformation function generates the output set {eax, ebx} because from this instruction on, both the registers eax and ebx depend on eax in some way. If the next instruction is “xor ecx, ecx, eax”, the input set {eax, ebx} is changed to {ebx} because the xor instruction sets eax to a value that does not depend on any of the input registers. After the xor instruction, eax does not depend in any way on the tracked registers and can be removed from the register set.

This is where the reduced instruction set of REIL really begins to shine. Since there are only 17 different instructions, you have to implement at most 17 different transformation functions that turn the input abstract program state of a node into an output abstract program state. In practice, you will have to implement far fewer transformation functions because most algorithms can handle transformations for multiple instructions uniformly (just think about register tracking and the add, sub, mul, div instructions).

The transformation functions are sufficient to do abstract interpretation along a single control flow path. However, they can not be used when multiple control flow paths converge into a single control flow path. To handle this special case, all MonoREIL algorithms have to implement a function that can take an arbitrary number of abstract program states and merge them into a single program state. If the register tracking algorithm receives the set {eax} from one path and the set {ebx} from another path, the input set of the node where these control flow paths merge is the union of the two input sets {eax, ebx}. In the node where the two control flow paths merge, both registers are tainted.

That’s pretty much what you have to do to implement your own code analysis algorithm. There are a few minor implementation details you have to consider to make sure that your MonoREIL algorithm terminates and returns the right result. For example, you have to make sure that your abstract program states never lose previously gained information. If they do, it would be possible to lose information in one step and regain it in the next step, leading to infinite loops where information is constantly lost and regained. This monotonous property of abstract program states is what gave MonoREIL its name.

Once you have defined all of the mentioned interfaces, you can tell MonoREIL to run your analysis algorithm. MonoREIL traverses the instruction graph and applies abstract program state transformations along the control flow path. This process continues until no new information about the program state can be discovered. For each node of the instruction graph, MonoREIL then returns the final abstract program state for the node. This information is the result of the analysis algorithm and can further be interpreted and displayed in the GUI by your custom analysis code.

If you want to know more about MonoREIL you can check out the slides of our CanSecWest 2009 presentation Platform-independent static binary code analysis using a meta-assembly language where we implemented a MonoREIL algorithm to detect array access operations with negative array indices. MonoREIL is also mentioned in the slide sets Applications of the reverse engineering language REIL, Automated static deobfuscation in the context of Reverse Engineering, and The Reverse Engineering Language REIL and its Applications.
BinDiff 3.2 public beta phase starts today

August 17th, 2010

Because this is my first post here I would like to introduce myself briefly. I have been working for zynamics since 2006 and my primary task is Java development. My main product responsibilities are the VxClass similarity graph visualization applet, parts of BinNavi and the complete BinDiff GUI.

Today we are officially starting the BinDiff 3.2 public beta phase. Besides many bug fixes the quality of the diff engine has been improved. Also, this version is shipped with a new C++ based exporter plugin for IDA which unifies the export process between BinNavi and BinDiff.

Here is an excerpt of the change list:

  • Added new matching algorithms (e.g. loop head matching)
  • Improved performance (better utilization of multi-core machines)
  • Support for multipe simultaneous differ instances
  • Memory optimizations
  • Function matches can be deleted and added manually
  • Colored matched function table rows (according to their similarity)
  • Various usability changes like wait dialogs for long running operations
  • ~80 more fixes and improvements in the exporter
  • ~50 more fixes and improvements in the BinDiff core engine
  • ~15 more fixes and improvements in the BinDiff GUI

We also increased our test database of IDB samples for stress testing the exporter and the BinDiff core engine to ~10GB. This includes large non-malicious samples (CISCO router images, Firefox, Acrobat, …), patch diff samples (Microsoft, MMO games, …), a huge selection of small but heavily obfuscated malware samples and some really obscure platforms. Every IDB we have ever received with a bug report or feature request is included in this database – please do keep ’em coming! In addition to that our distributed BinDiff engine integrated with zynamics VxClass, our malware clustering product, churns through gigabytes of fresh malware samples each month.

If you are a zynamics customer and interested in participating in the beta phase, please write an e-mail to support@zynamics.com. Any kind of feedback, feature requests or bug reports are very much appreciated.

Challenging conventional wisdom on AV signatures (Part 2 of 2)

August 13th, 2010

A while ago I posted a blog entry called “challenging conventional wisdom on AV signatures (Part 1 of 2)”. There, I argued that the fundamental problem with traditional AV byte signatures is the of lack of information asymmetry: The defender and the attacker both have access to the same information, and the attacker can run a potentially infinite number of test-runs to make sure he can reliably bypass all of defensive measures the defender has taken.

The important thing to take away from that blog post is that the problem with AV signatures is not inherent to “signatures” – it is a matter of information symmetry.

Now, how can one change this situation? Is there a clever way to make traditional byte signatures useful again? Can we somehow introduce information asymmetry in a productive manner?

To investigate this, we have to remember another blog post where I described some of our results on generating “smart” signatures (this appears to be AV lingo for signatures that are not checksum-based, but which consist of bytes and wildcards). The summary of this blog post is more or less: “With the algorithms underpinning VxClass, we can not only automatically cluster malicious software into groups, we can also generate signatures for each group automatically. And one signature will match the entire group.”

There was one small bit of information missing in that post that will make this post interesting: We can usually generate dozens, if not hundreds, of different signatures for the same cluster of malware. These signatures match, by construction, on all samples of a particular cluster, but they have nothing in common – they match on different bits of the code.

Where does this leave us? Well, it leaves us with a pretty cool system that we call VxClass for Financials (although it is possible to substitute ‘Financials’ with other large verticals that are often victims of targeted attacks). The system works as follows:

  1. Different financial institutions each get a user account on a centralized VxClass server
  2. Users upload malicious software that they have recovered (using tools such as Memoryze) from their own systems
  3. Users are anonymous by default
  4. Users can see how malware they upload clusters; they can also see how similar their malware is to malware other users uploaded
  5. Users can only download their own malware, not the malware of other users
  6. For each cluster, users can generate a personalized detection signature that no other user will ever see

Why is this cool ? Well, for one thing, every user profits from uploading to the system — the more samples are present in one cluster, the better the predictive power of the signatures. At the same time, users do not have to share any confidential information with each other — they are encouraged to, but they do not have to. Finally, even if some users of the system are sloppy and leak their signatures to the attacker, they only endanger themselves – everybody else has their own signatures, and will thus not be affected by this signature leak. This is important – normally, when I share methods of detection with others, I risk losing them. Not here.

We are starting an evaluation/beta program of the system in the next 1-2 weeks — at the moment, targeted at the financial sector. If you happen to find this interesting, are working for a financial institution and want to participate in our test drive, please contact us at info@zynamics.com !

++staff (as opposed to staff++)

August 10th, 2010

Hi everyone,

my name is Jan Newger and I’ve just recently joined the team at zynamics. Previously, I finished my diploma thesis at the RWTH Aachen. The work was about code virtualization techniques and what mechanisms can be applied to extract readable code from such a protection system. In the past, I mostly fiddled with reverse engineering and especially anti-reverse engineering techniques, wrote some libraries as well as a few IDA Pro plugins.

From now on, I’ll be working  together with Tim and Sebastian on BinNavi and I’m looking forward to develop my skillz in such an excellent team of researchers here at zynamics.

PDF Dissector 1.5.0 released

August 5th, 2010

Apart from a few bug fixes, version 1.5.0 of our PDF malware analysis tool PDF Dissector brings two very cool new features.

The first cool new feature is that PDF Dissector now supports the decryption of RC4-encoded strings and streams. This is very useful because there are a few PDF malware samples in the wild that encrypt their strings and streams using RC4 (a standard PDF format feature). In the past, PDF Dissector was not able to analyze these PDF files. From now on, PDF Dissector can be used on those samples too.

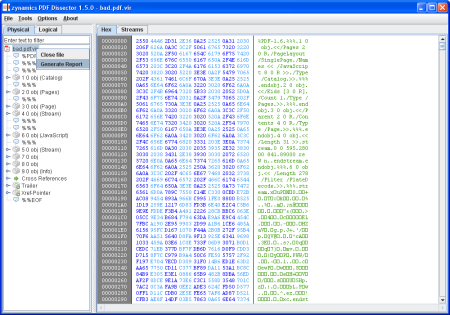
The second cool new feature is an improvement to the plugin API that allows plugins to extend the context menu of PDF file nodes in the PDF browsing tree. This was inspired by a customer who asked for a way to generate reports with PDF Dissector. I implemented a small report generator as a Python plugin to make sure that all customers who want to generate reports can easily modify the content and the layout of the generated report.

Extended context menu for generating reports

To learn more about PDF Dissector, please visit the product site or the PDF Dissector manual.

BinNavi 3.0 released

August 2nd, 2010

We are proud to announce that BinNavi 3.0, the latest version of our graph-based reverse engineering tool, was released today. Previous versions of BinNavi have already helped reverse engineers in the IT security industry, in governmental agencies, and academia around the world do their jobs faster and better. The new version of BinNavi will definitely by very welcomed by existing and new customers because it is a huge improvement compared to BinNavi 2.2.

I have already talked about the most important new features in a previous blog post when the first beta of BinNavi 3.0 was announced. For example, I mentioned the improved exporter that is used to get information from IDA Pro into BinNavi. Back then I was excited about processing about 80.000 functions per hour. Between the first beta and the final release we managed to improve this number again. For the screenshots below I exported more than 110.000 functions in just 15 minutes. This improvement alone makes me never want to use earlier versions of BinNavi again.

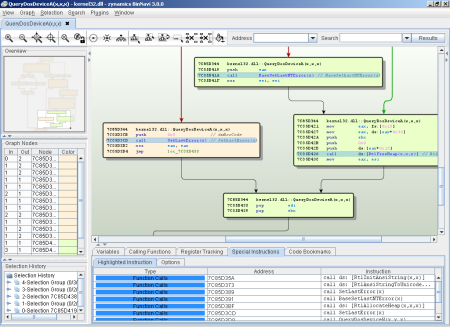
Let’s take a look at a few new screenshots of BinNavi 3.0.

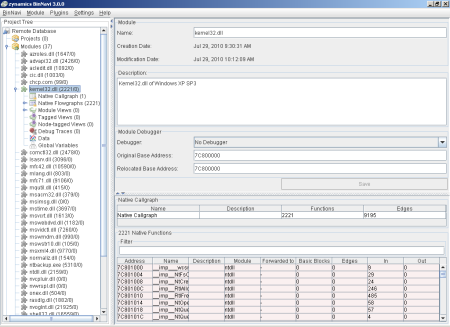
The BinNavi main window

The general layout of the main window stayed the same. On the left-hand side you can configure databases to work with. In the screenshot you can see that I configured a database called Remote Database that contains 37 modules (disassembled files). These modules can then be loaded to browse through the disassembled code. The right-hand side of the main window changes depending on what node of the project tree you have selected. In the screenshot you can see detailed information for the module kernel32.dll.

Analyzing disassembled code

The second screenshot shows the so-called graph window where you analyze disassembled code. BinNavi always shows disassembled code as flow graphs. This makes it easier for reverse engineers to follow the control flow. In the screenshot I have changed the default color of some basic blocks and told BinNavi to highlight all function call instructions.

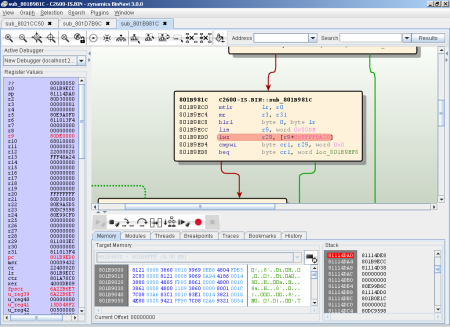
Debugging a Cisco 2600 router

The third screenshot shows a BinNavi debugging session. The debug target is a Cisco 2600 router. The next instruction to be executed is highlighted in the graph. On the left-hand side you can see the current register values. On the bottom you can see a dump of the RAM and the current stack.

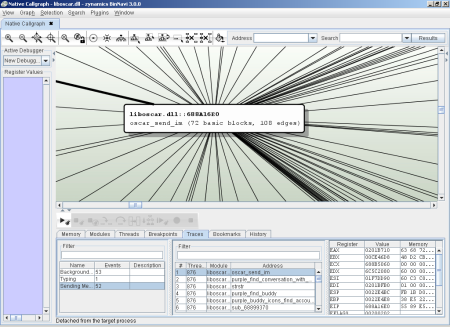
Collecting program state in trace mode

In cases when manual debugging is not enough, you can switch to trace mode. In trace mode, breakpoints are set on all nodes of the open graph and whenever a breakpoint is hit, the current register values and a small memory snapshot are recorded. This feature is so useful for quickly isolating interesting code that you should really check out the video that demonstrates this feature.

That’s it for now. If you want to learn more about BinNavi please check out the product website and the manual. If you are having any questions please leave a comment or contact the zynamics support.

Win32 Kernel Debugging with BinNavi

July 29th, 2010

Hi everyone,

we – that would be Andy and Felix – are student interns at zynamics in Bochum. We both study IT-Security at the University of Bochum in our 8th semester and have both been with the company for several years now.

For the last half year we have been working together on a WinDbg kernel-debugging interface for zynamics’ reverse engineering tool BinNavi. After our latest bug fixes and code improvements we now feel ready to announce that this piece of software has finally reached alpha status. It is now almost feature complete but still got some rough edges and known bugs.

What does this mean to you as a (maybe future) BinNavi customer?

You will be able to use all the advanced debugging features of BinNavi for remote Win32 driver and kernel debugging. All you need to have is a machine with BinNavi and the Microsoft Debugging Tools for Windows installed and – of course – a second Win32 (virtual) machine you want to debug. Given these prerequisites, you can directly start to explore the vast and dark realms of Win32 kernel land from an easy-to-use, nice and cozy GUI. There are probably other tools out there to do this. But only BinNavi provides you with all the powerful features of our Differential Debugging technology. Please see Sebastian’s post from a few weeks ago to understand why we are so excited to bring this technology to ring0.

To give you an idea of how kernel debugging with BinNavi looks like, we took three screenshots. The first one shows the driver selection dialog that BinNavi displays right after attaching to a target machine. The second one displays a function trace of mrxsmb.sys on an idle Windows XP machine connected to a network. The 150 functions called during our trace are enumerated in the lower mid, while the recorded register and memory values for each call are displayed in the lower right. In the third screenshot you can see us single-stepping a random function in mrxsmb.sys.

Selection of the target driver

Function trace of mrxsmb.sys on idle machine

Single-stepping mrxsmb.sys

Once we are done polishing our code, we will post here again on this site to demonstrate how this technology can facilitate the process of finding the interesting code parts in Win32 drivers. Specifically, we will use Differential Debugging to pin point the code parts that are responsible for password processing inside the driver of a certain closed-source HDD encryption product. This is interesting both for writing a password brute-forcer and for checking for implementation mistakes.

If you are an existing BinNavi costumer and want to play a bit with the current alpha version, just let us know – we will be happy to supply you with the latest build. Beside that, the final version will be shipped to all customers with one of the next BinNavi updates.

Dumping shellcode with Pin

July 28th, 2010

About six weeks ago, when I blogged about the Adobe Reader/Flash 0-day that was making the rounds back then, I talked about generating automated shellcode dumps with Pin. In this post I want to talk a bit about Pin, dynamic binary instrumentation, and the shellcode dumper Pintool we developed at zynamics.

Dynamic binary instrumentation is a technique for analyzing binary files by executing the files and injecting analysis code into the binary file at runtime. This method is not exactly new. It has been in use for many years already, for example in program verification, profiling, and compiler optimization. However, despite its amazing power and ease of use, dynamic binary instrumentation is still not widely used by binary code reverse engineers.

The two most important dynamic binary instrumentation tools for binary code reverse engineers are Pin and DynamoRIO. Pin is developed by Intel and provided by the University of Virginia while DynamoRIO is a collaboration between Hewlett-Packard and MIT. Both are free to use but only DynamoRIO is open source.

In general, both Pin and DynamoRIO are very similar to use. If you want to use either tool you have to write a C or C++ plugin that contains your analysis code. This code is then injected into the target process by Pin or DynamoRIO. For most reverse engineering purposes, Pin and DynamoRIO are both equally useful and when you talk to reverse engineers who make use of dynamic binary instrumentation it often seems to be a matter of personal taste which tool they prefer. At zynamics we use Pin because the API for analysis code seems cleaner to us.

Let’s get back to shellcode dumping now. The idea behind shellcode detection is rather simple: Whenever an instruction is executed, check if that instruction belongs to a section of a loaded module in the address space of the target process. If that’s the case, then the instruction is considered legit (not shellcode). If, however, the instruction is outside of any module section, and therefore most likely on the stack or allocated heap memory, the instruction is considered shellcode. This heuristic is not perfect, of course. However, it works surprisingly well in practice.

In fact, the Pintool we developed does exactly this. For every executed instruction in the target process it performs the check described in the above paragraph. Until shellcode is found, the Pintool keeps track of up to 100 legit instructions executed before the shellcode. Then, when shellcode is found, it dumps the legit instructions before the shellcode and the shellcode itself. The big value of our Pintool is not that it dumps the shellcode. The big value is that it tells you exactly where control flow is transferred from the legit code to the shellcode. With this information you can quickly find the vulnerability in the exploited program. If you are really interested in the shellcode, you can also just set a breakpoint on the last legit instruction before the shellcode and do a manual analysis from there.

You can find the complete documented source of our shellcode dumper Pintool on the zynamics GitHub. The source code is surprisingly short and I did my best to document the code. If you are having any questions about the source code, please leave a comment to this blog entry or contact me in some other way.

Let’s take a look at the output of a sample run now. You can find the full trace log on GitHub but here are the important parts.

What you always want to look for is the string “Executed before”. These are the legit instructions before control flow is transferred to the shellcode. Ignore the first occurence of this string. I have not had a deeper look what code is recognized as shellcode there, but it might be JIT-compiled Adobe Reader JavaScript code (which also does not belong to any section of any module and is therefore detected as shellcode). The second occurence of the string is what you want to look at.

[sourcecode]Executed before
0x238C038E::EScript.api  E8 D2 72 F6 FF  call 0x23827665
0x238BBF4F::EScript.api  8B 44 24 04     mov eax, dword ptr [esp+0x4]
0x238BBF53::EScript.api  C6 40 FF 01     mov byte ptr [eax-0x1], 0x1

[ … more EScript.api instructions … ]

0x2D841E82::Multimedia.api  56           push esi
0x2D841E83::Multimedia.api  8B 74 24 08  mov esi, dword ptr [esp+0x8]
0x2D841E87::Multimedia.api  85 F6        test esi, esi
0x2D841E89::Multimedia.api  74 22        jz 0x2d841ead
0x2D841E8B::Multimedia.api  56           push esi

[ … more Multimedia.api instructions … ]

0x2D841E96::Multimedia.api  8B 10        mov edx, dword ptr [eax]
0x2D841E98::Multimedia.api  8B C8        mov ecx, eax
0x2D841E9A::Multimedia.api  FF 52 04     call dword ptr [edx+0x4]

Shellcode:
0x0A0A0A0A::  0A 0A                      or cl, byte ptr [edx]
0x0A0A0A0C::  0A 0A                      or cl, byte ptr [edx]
0x0A0A0A0E::  0A 0A                      or cl, byte ptr [edx]

[ … more shellcode … ][/sourcecode]

The log clearly shows that control flow is transferred from EScript.api (the Adobe Reader JavaScript engine) to Multimedia.api (the Adobe Reader multimedia library) and then to shellcode which does not lie in any module section. You can even see that the exploit code controls the memory address of [edx + 0x4] in the last executed instruction of Multimedia.api. With this knowledge you can work back from this point to see what exactly the vulnerability is that was exploited. In the example, the vulnerability was the use-after-free media.newPlayer vulnerability of older Adobe Reader versions. This vulnerability uses JavaScript code to trigger a bug in the Multimedia API.

In case you are wondering about gaps in the instruction trace (for example at calls), please note that each instruction is only dumped once. So, if a function is called twice, the second call is not dumped to the output file anymore. This behavior was added to keep log files small.

I think the shellcode dumper is a good example for a first Pintool. The idea behind it is really simple and the actual Pintool can be improved by interested readers many ways (dump register values or improve the shellcode detection heuristic, for example). If you are making improvements to the tool, please let us know.

PDF Dissector 1.4.0 released

July 22nd, 2010

PDF Dissector 1.4.0 (Product site / Manual) fixes a few PDF parser bugs, improves the Adobe Reader emulation, and adds a cool new feature you can use for searching through all open PDF files.

Here is the detailed list of changes:

  • Feature: Added a way to search through the content of all open files.
  • Feature: Annotation names are now correctly emulated.
  • Bugfix: Fixed a parser bug that led to missed data streams if there was a comment between an object and its stream.
  • Bugfix: Fixed a parser bug that led to crashes when parsing invalid octal numbers.
  • Bugfix: All tabs belonging to a file are now closed when closing the file.

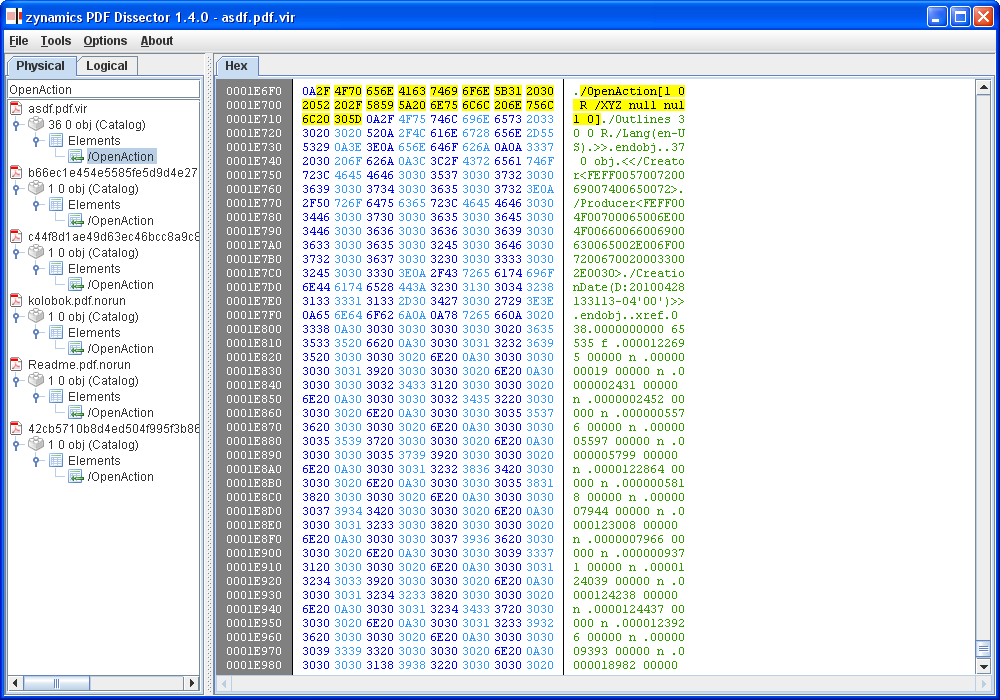
In PDF Dissector 1.4.0 you will now find a text field above the PDF browser where you can enter text strings to search for. The search function searches through dictionary keys, dictionary values, strings, data streams and other elements of PDF files and displays only those elements that match the search string. This is very useful if you want to answer questions like ‘which PDF files of my collection use JavaScript’?

The screenshot below shows how I used the filter to search through about 50 PDF files for exactly those that use the OpenAction command to execute some code when the PDF file is opened.

The new filter function in PDF Dissector 1.4.0

The REIL language – Part III

July 19th, 2010

In the first and second part of this series I have given an overview of our Reverse Engineering Intermediate Language (REIL) and talked about the purpose and structure of the individual REIL instructions. This third part is about REIL code generation.

REIL is included in BinNavi to help users write their own code analysis algorithms, often based on abstract interpretation. However, obviously our users are not really interested in analyzing REIL code. What they really want is to analyze the native assembly code of their target binary file. The REIL language can nevertheless be used by all users of BinNavi. The translation from native assembly code to REIL code is just as simple and transparent as porting the results of REIL analysis back to the original code.

BinNavi 3.0 ships with REIL translators for ARM, MIPS, PowerPC, and x86 code. Code from any of these native assembly languages can be translated to REIL code with the same effect on the program state as the original code. Users can then analyze the effects of the much simpler REIL code and port the results of the analysis back to the original native assembly code they are really interested in.

The translation process from native assembly code to REIL code is very simple. Given a list of native assembly instructions, each individual instruction is translated to REIL code. In a second pass, the generated linear listing of REIL code is taken and converted into a control flow graph. This control flow graph is then passed to the user and he can use it in his code analysis algorithm.

When writing the translators, we made sure that all native assembly instructions could be translated to REIL code without needing any information about the instructions before or after the current instruction. This allowed us to keep the individual instruction translators stateless.

Generally multiple REIL instructions are emitted by the translators for any native input instruction. Consequently it is not possible to keep a 1:1 mapping between the addresses of the original assembly instructions and the addresses of their corresponding REIL instructions. The solution we found was to multiply every native address by 0x100 to calculate the base address of all REIL instructions that belong to a native instruction. The lowest byte of such REIL addresses can then be filled by an index that specifies the relative position of a single REIL instruction inside the sequence of REIL instructions generated from the same native input instruction. What I mean here is that if you have a native instruction at address 0x08 the REIL translators will generate REIL instructions for it at addresses 0x800, 0x801, 0x802, …

This way of translating native instruction addresses to REIL instruction addresses limits us to at most 256 REIL instructions for each native instruction. In practice, even getting to 30 REIL instructions for one native instruction is rare although we have a few outliers that are translated to up to 70 REIL instructions.

There is another big advantage to this address translation method. For any given REIL instruction you can immediately determine its native source instruction. There is no need to consider any additional context around the REIL instruction. This is really important if you want to port the results of a REIL analysis algorithm back to the original code. If you have determined a result for a REIL instruction you can just divide its REIL address to 0x100 and you know the original instruction for which the result holds too.

Translating x86 code to REIL code

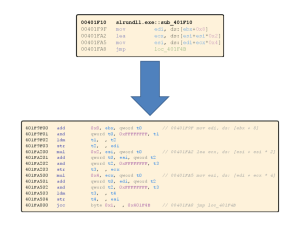
That’s it for now. If you have any questions about the translation process or REIL in general please leave a comment.