BinDiff 4.0 available today :-)

December 5th, 2011

After several months of silence due to our team moving, finding a new home, and generally working really hard, we are happy to announce today that a new version of BinDiff is available! While the underlying comparison engine has only changed slightly, we have some significant improvements on the UI, and some improvements that are particularly useful for porting symbolic information from FOSS libraries into your disassemblies. In the following, I will highlight my favourite new features:

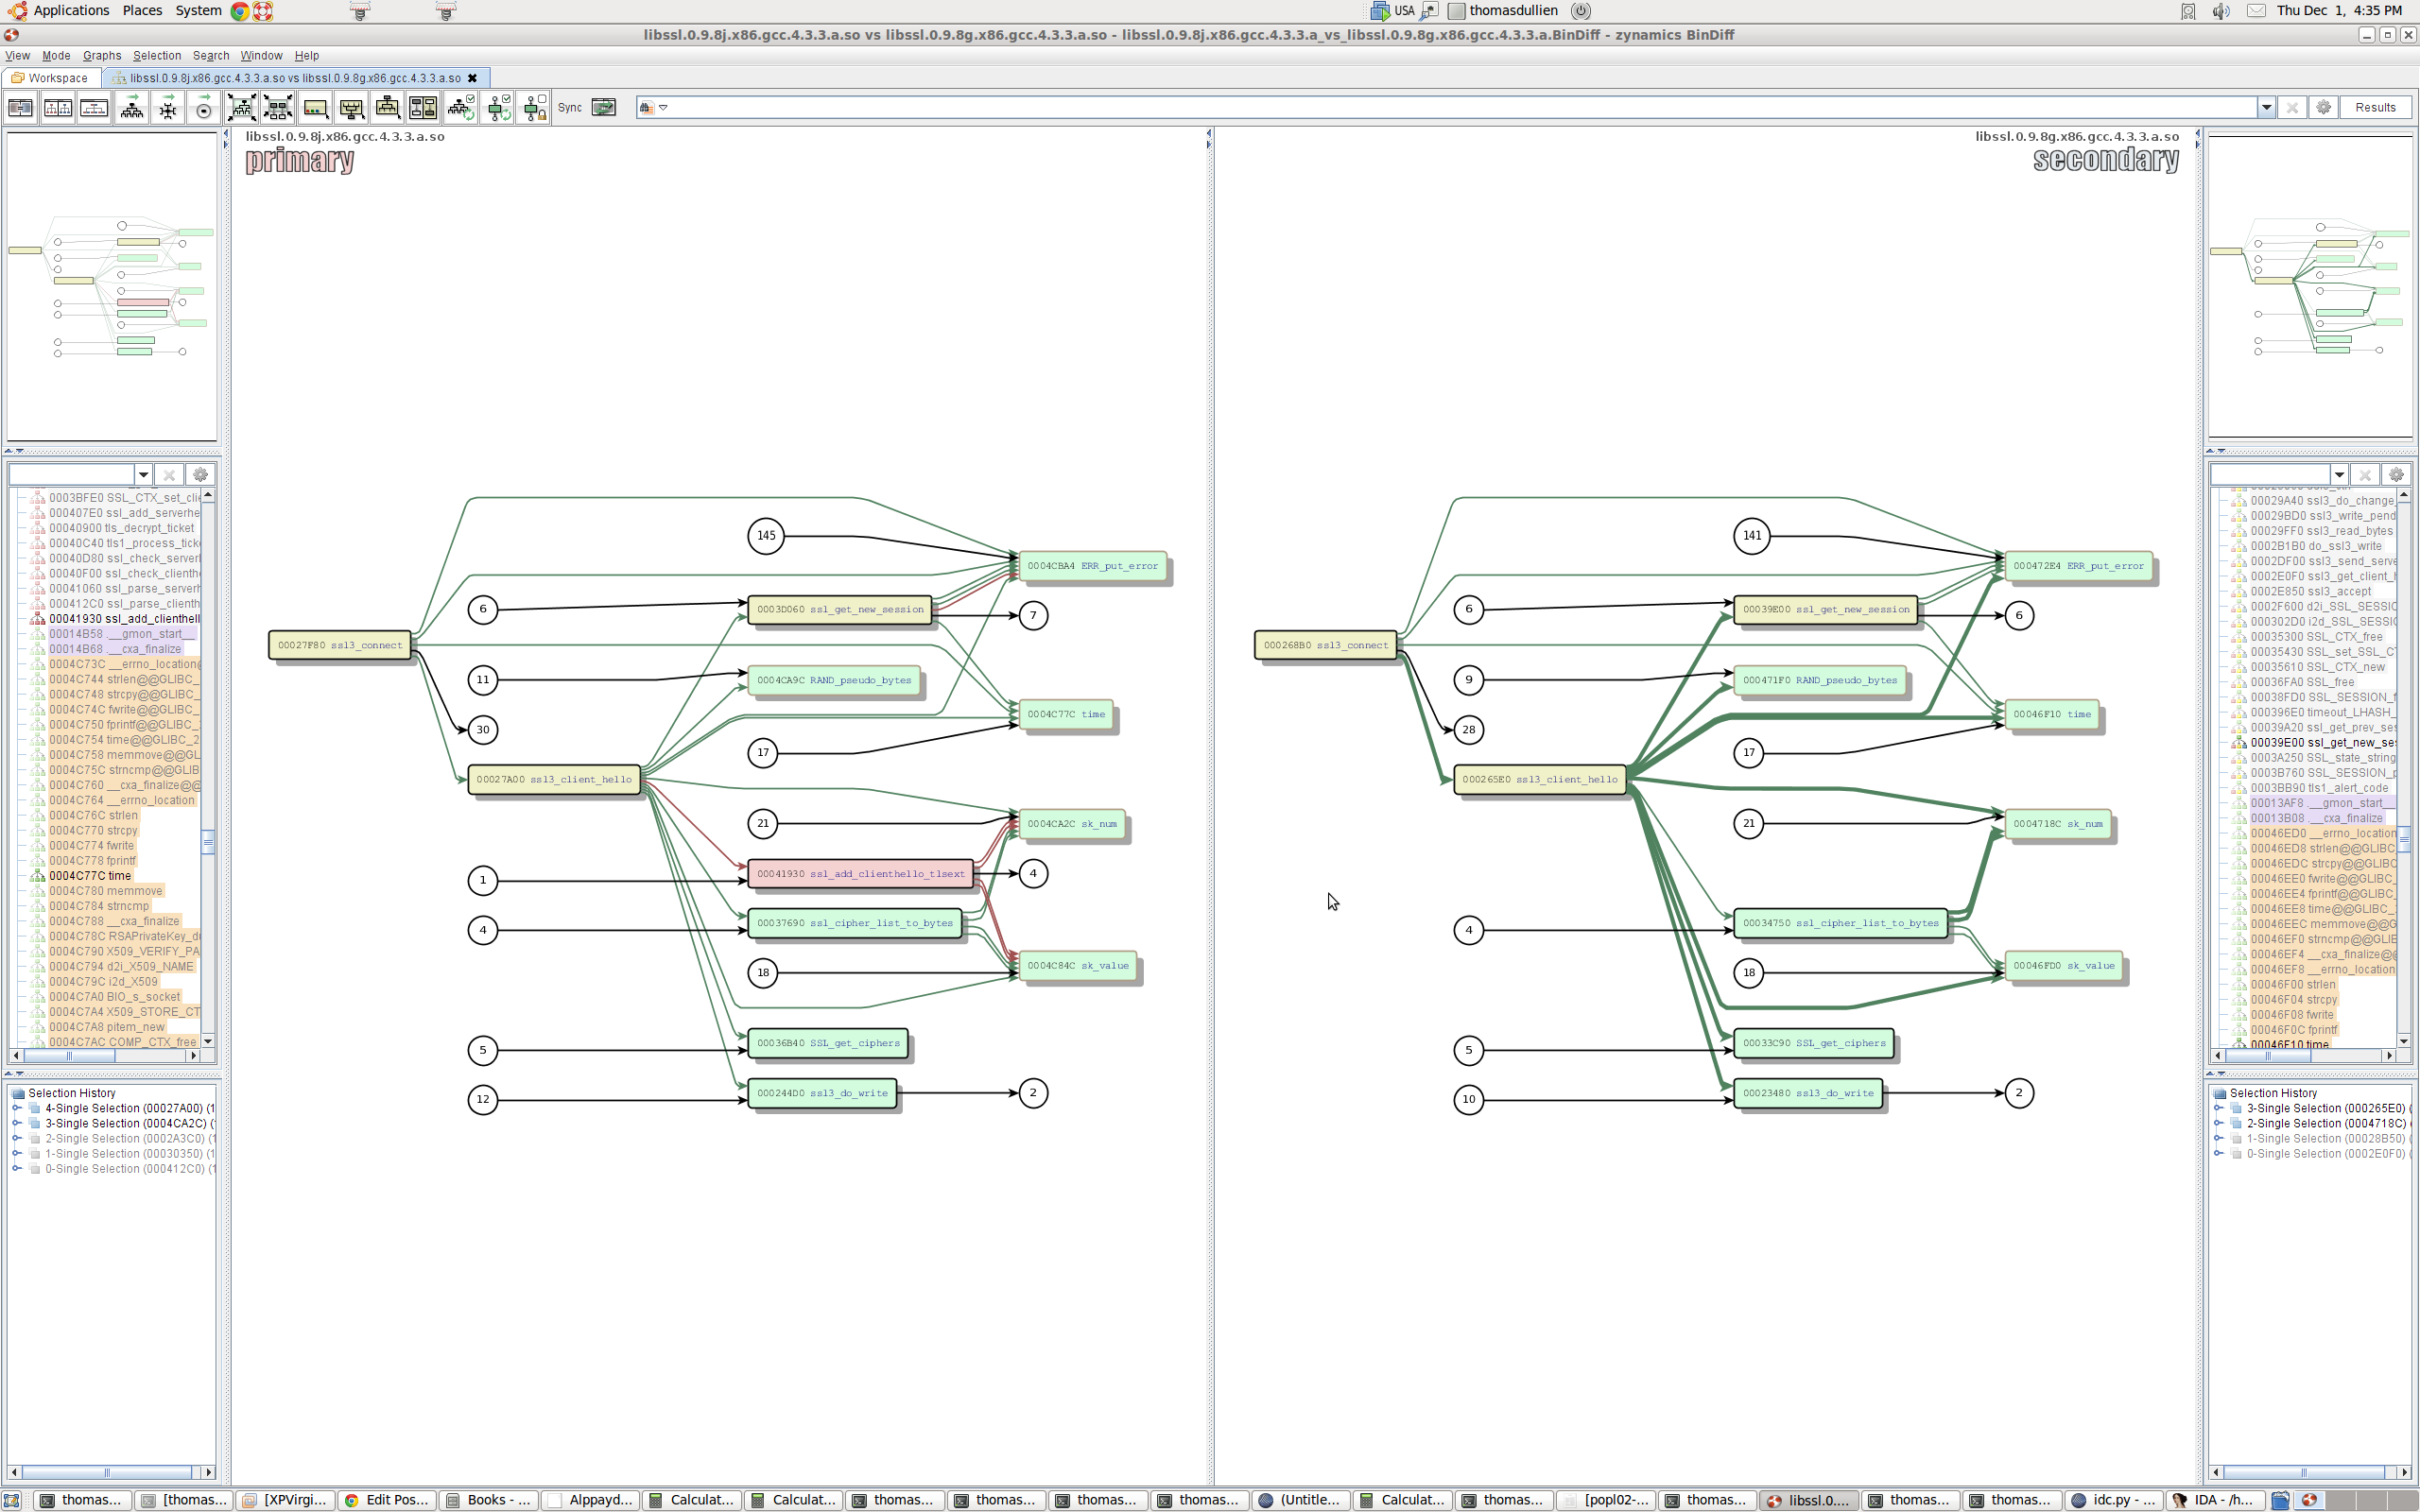
Call graph difference visualisation

With more complex differences between two executables, it is sometimes easy to miss the big picture by drilling down too much on changes to individual functions. With BinDiff 4.0, I now have the ability to not only examine changes on the level of the individual function, but also on the call graph. As with most UI improvements, an image is much more useful than a long diatribe; I will let the following screenshot speak for itself:

Examining changes on the callgraph level

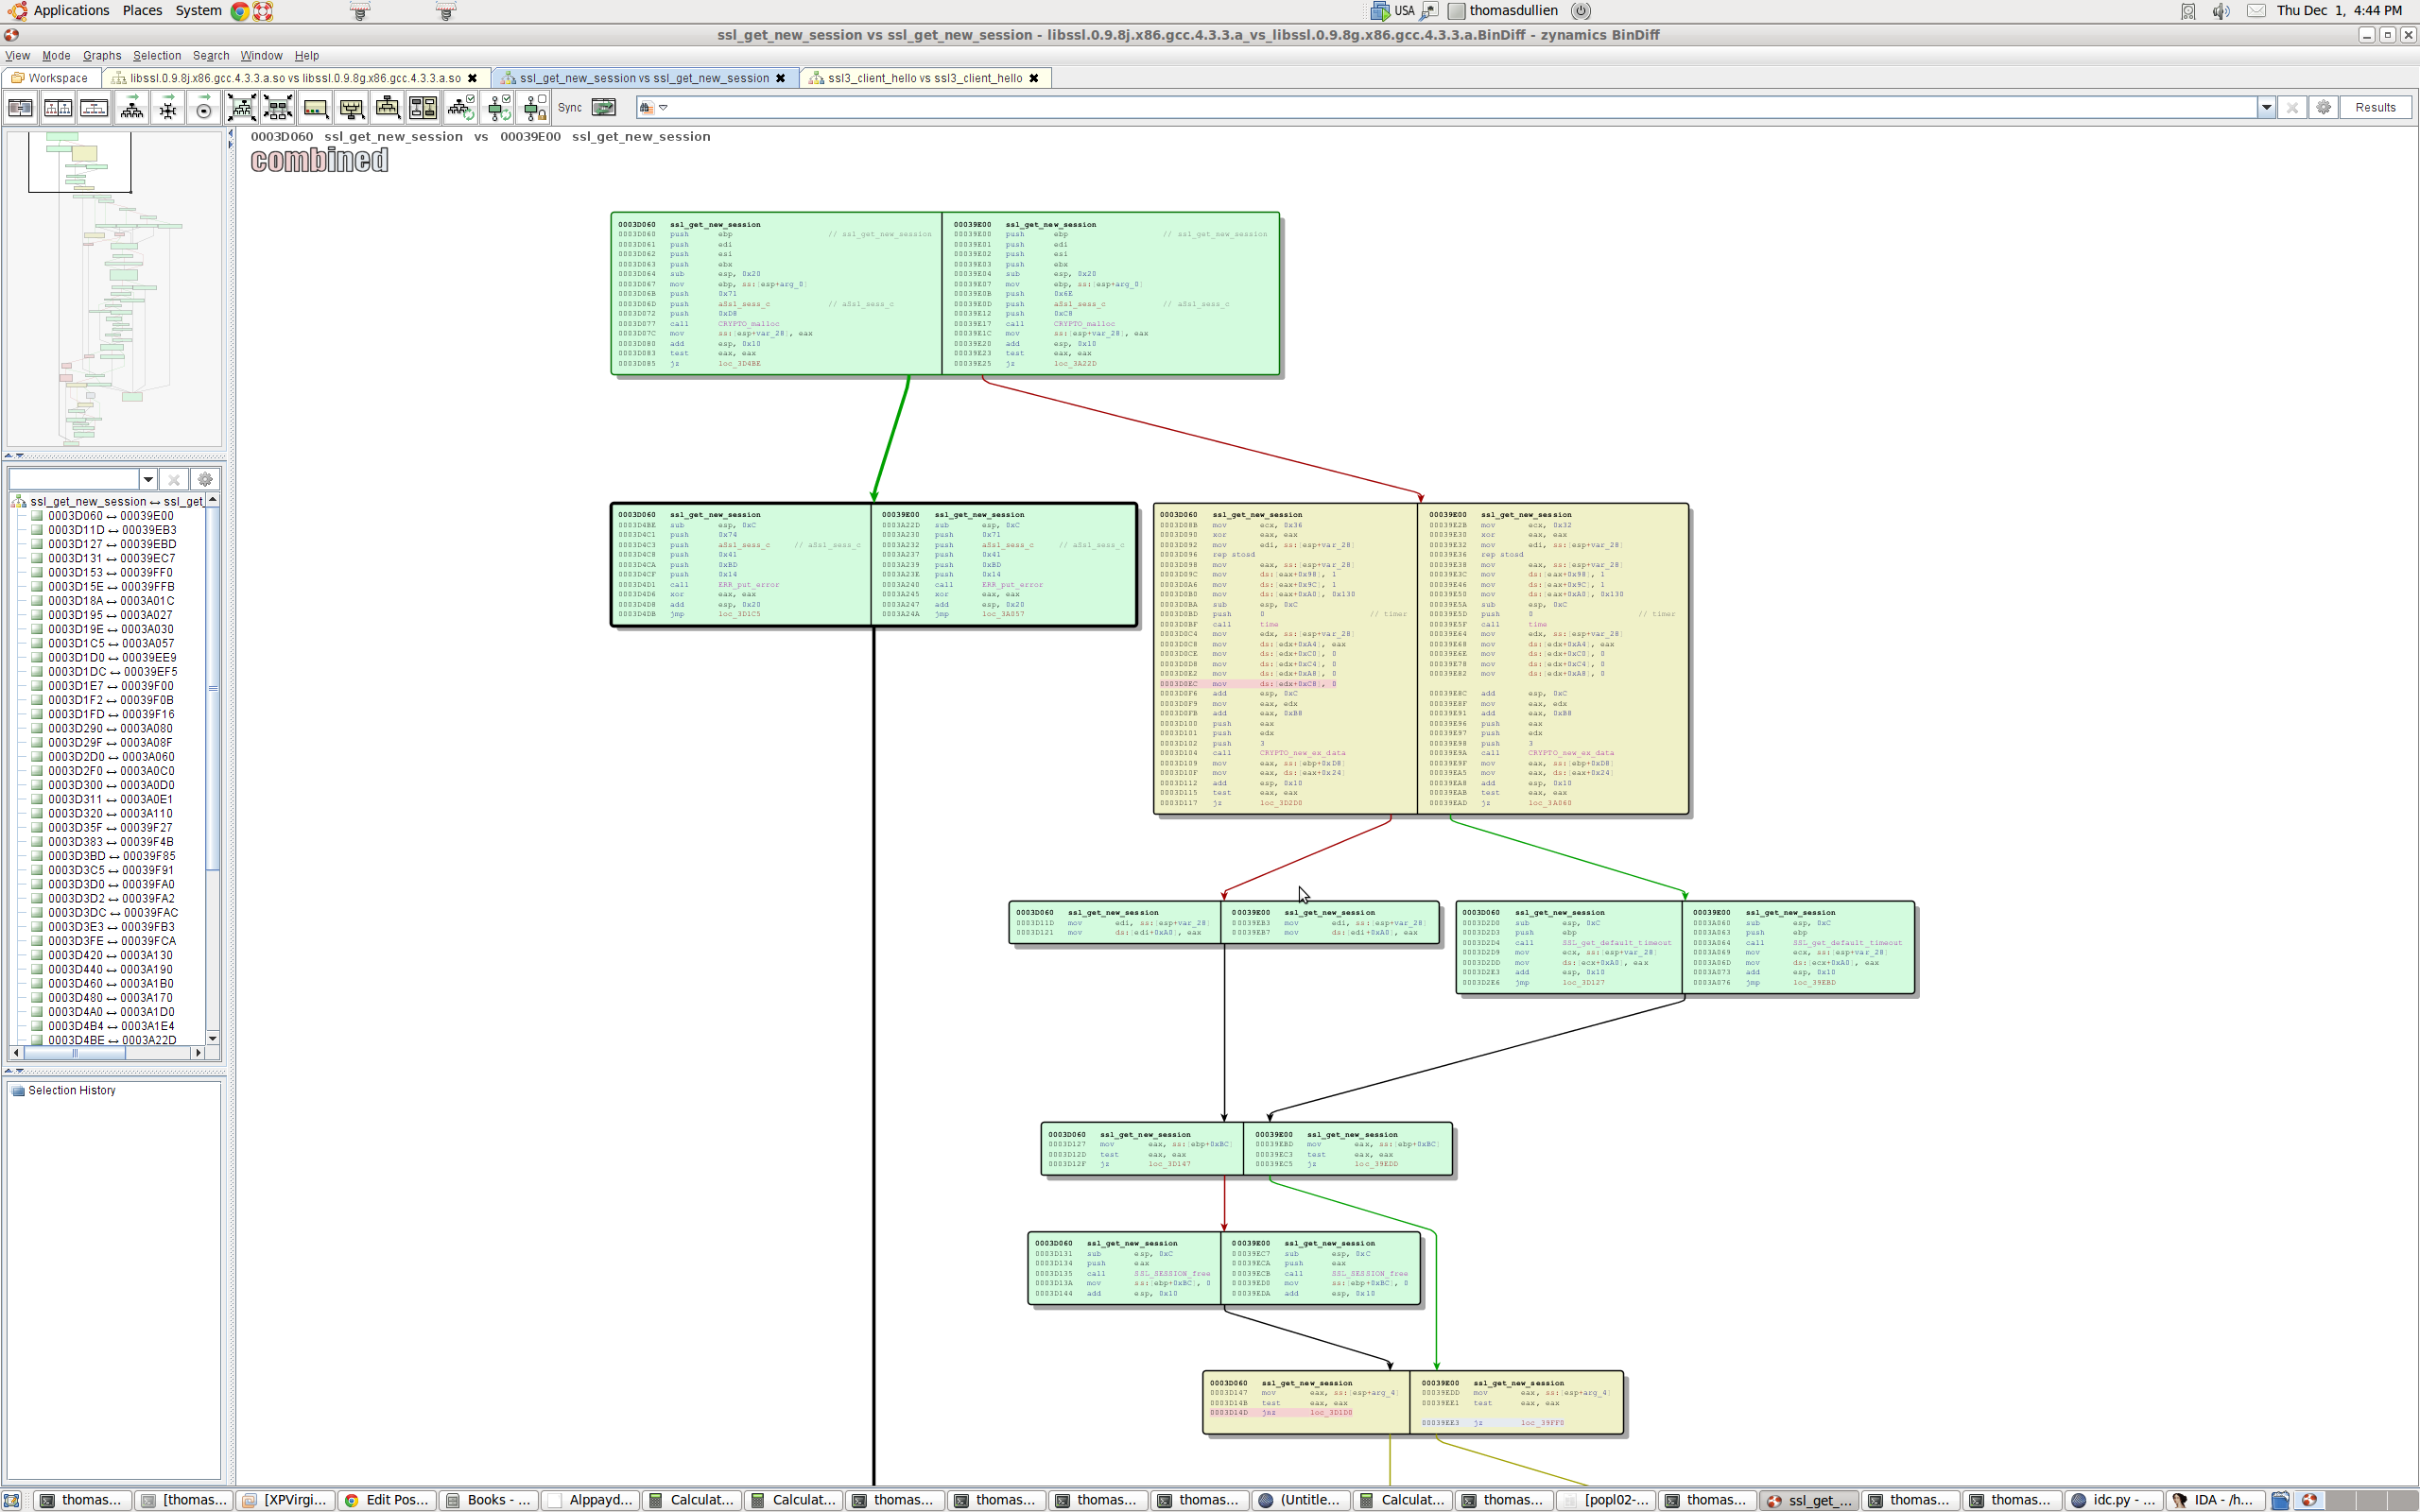
Combined visualization of two flowgraphs

Ever since the very first version of BinDiff, the only way to examine a change in a flowgraph was by using our split-screen approach: One function on each side, laid out in a similar manner, with colors indicating changes. While this works pretty well (and is still my favorite way of looking at changes), it is sometimes a bit cumbersome. In the new UI, we added an additional way of examining changes: We merge the two graphs into one, and have a vertical split on the basic block / node level. This allows full-screen examination of changes without the need for splitting the screen.

The combined visualisation of changes

Iterative diffing

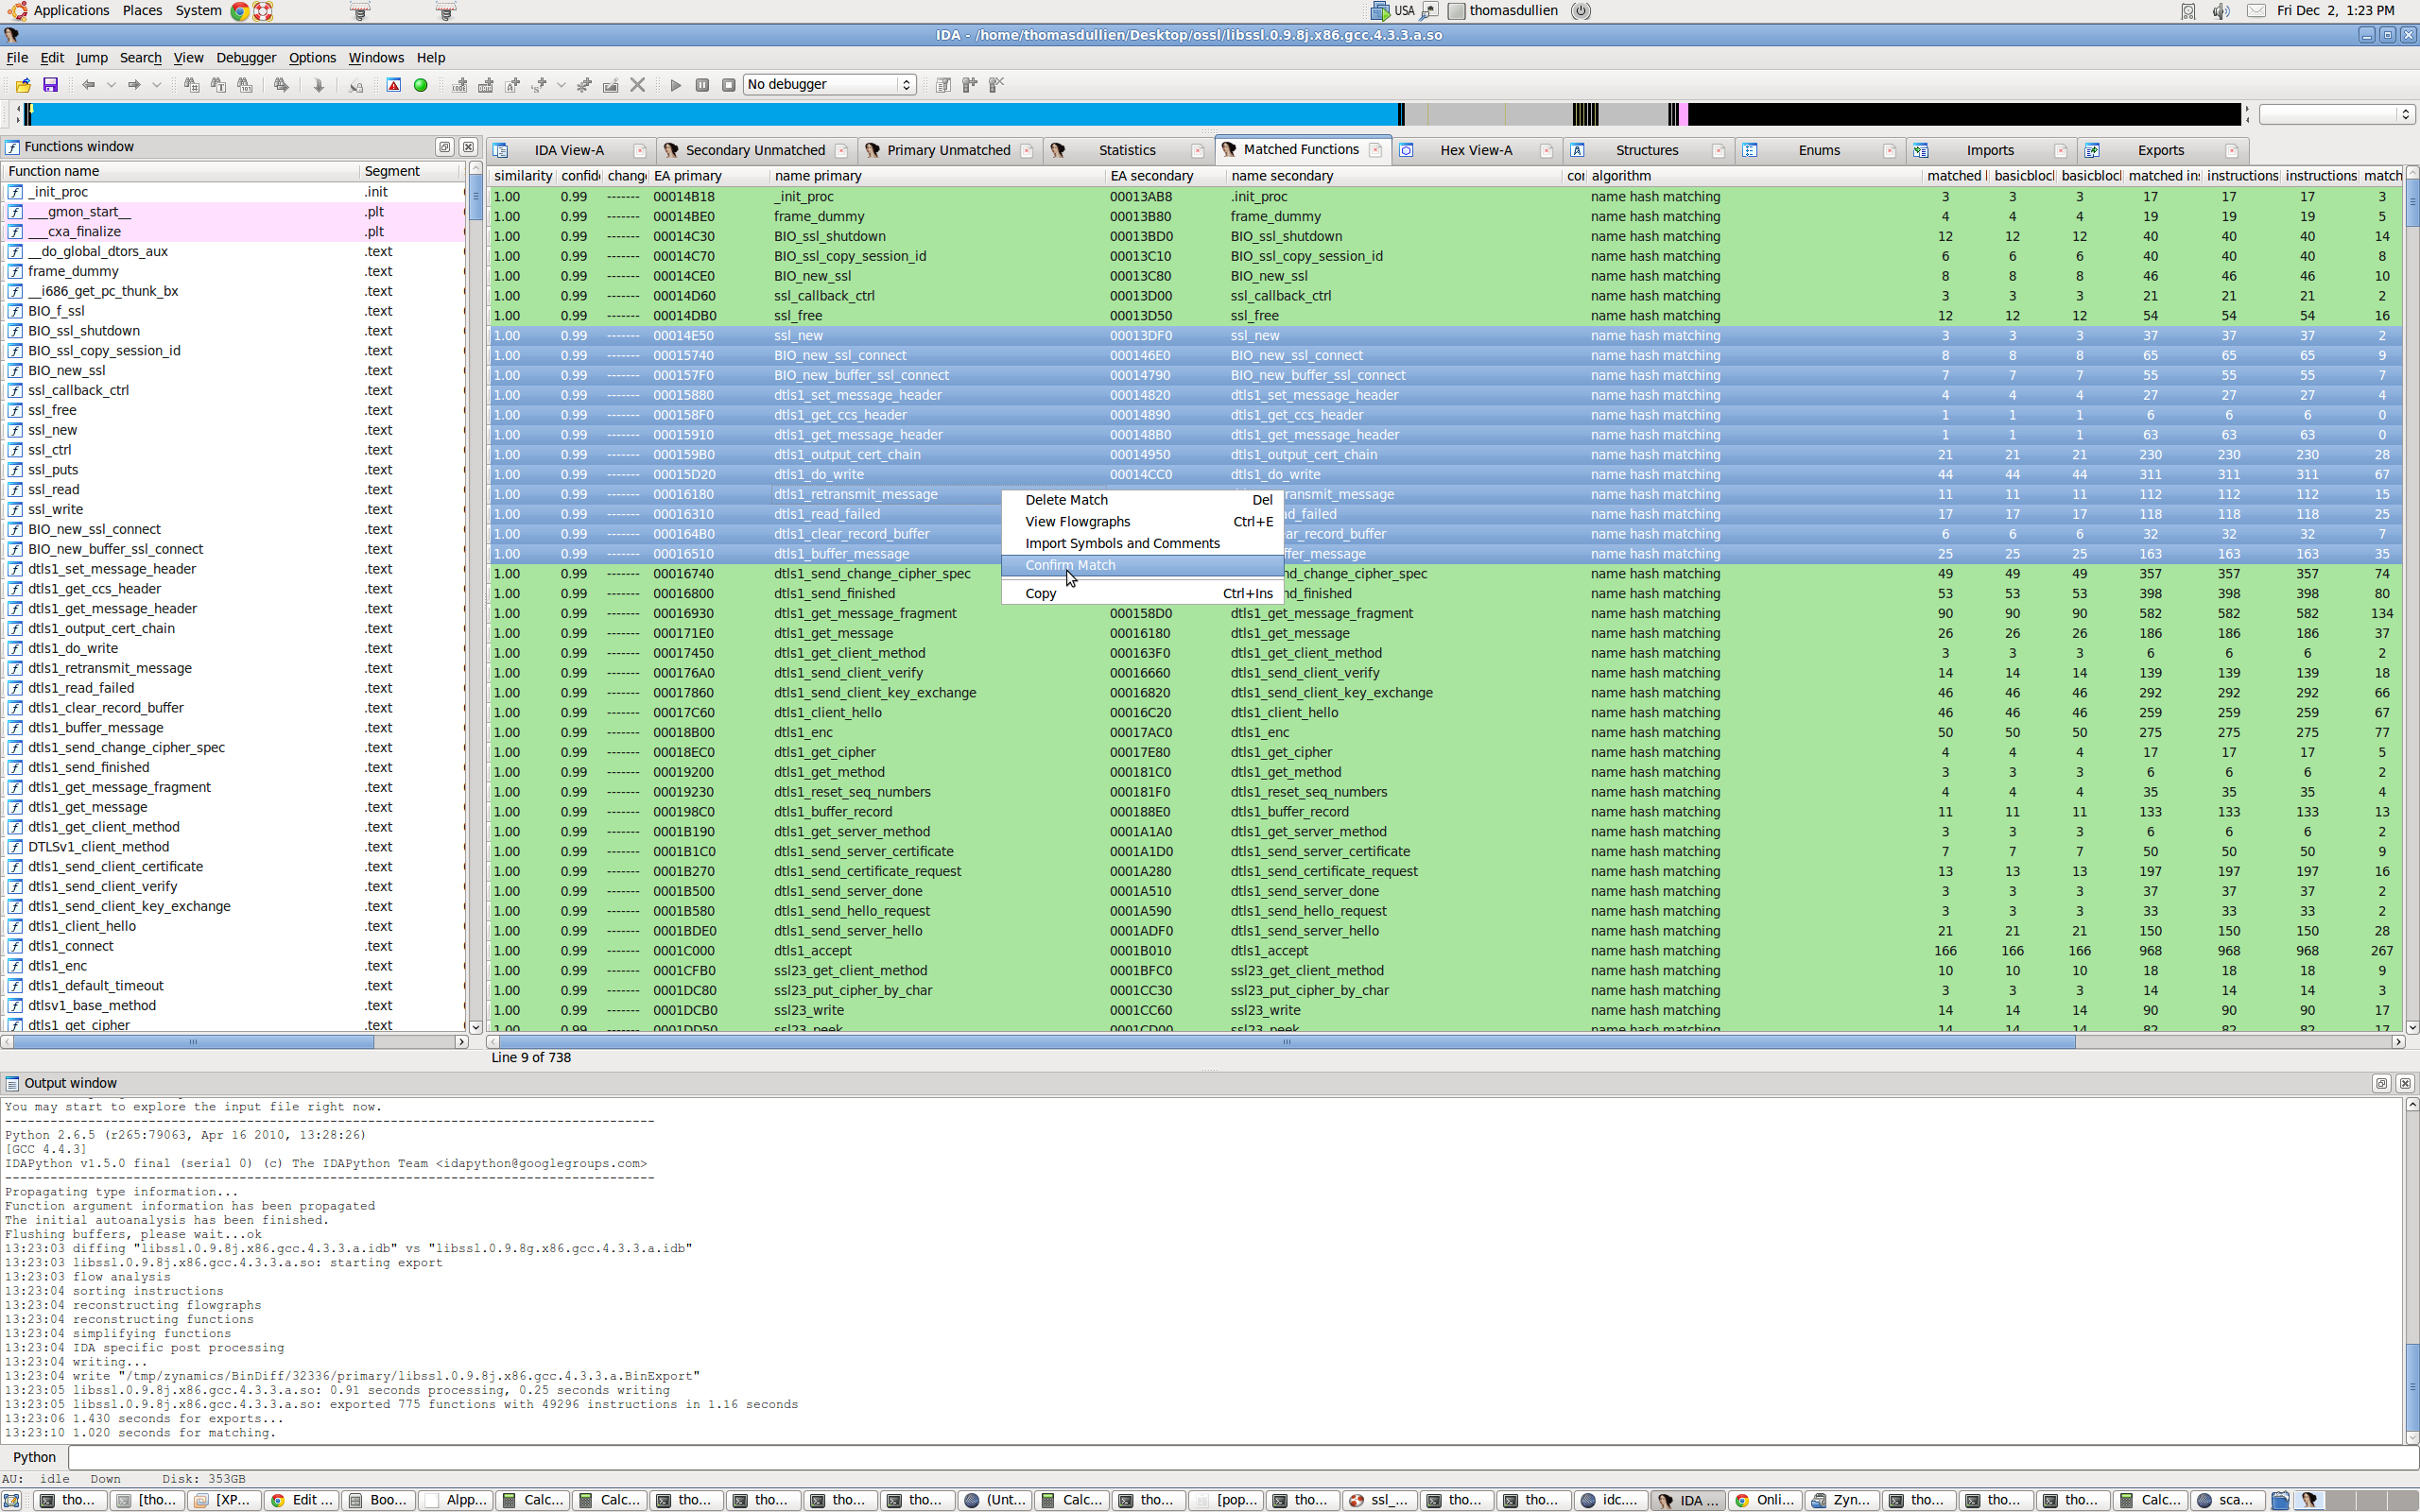
Over the last years, symbol porting has eclipsed patch analysis as my primary use for BinDiff. In many situations, I need to pull information from a FOSS project into an existing disassembly. I usually compile the FOSS project with symbols, attempting to approximate the build settings of the executable I am analyzing. I then BinDiff the disassembly against the compiled FOSS library and selectively import symbols and names for the functions that were recognized properly. While BinDiff often produces pretty good results, only a fraction of the functions will be recognized properly. In such situations, I often wished I could assist BinDiff infer further matches. With BinDiff 4.0, I can do just that: I can confirm that a pair of functions are matched correctly, and then tell BinDiff to re-run with the confirmed functions as starting points for further inference. This iterative approach allows me to match more and more functions while porting my symbols, yielding a much larger percentage of symbols in my disassembly than what would have been achieved in a single round of comparison.

Confirming a few matches

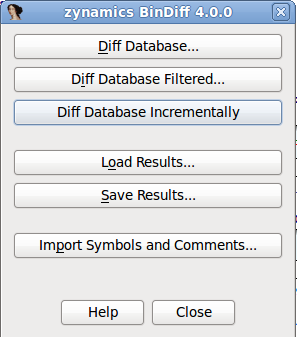
After confirming, click in the "Diff Database Incrementally" button

More Pie Charts

When comparing two pieces of related code, it is often useful to obtain a quick overview of the degree of code overlap between two files. What fraction of the functions in an executable could be mapped to the other executable? How similar were these functions? While all this information is available to BinDiff, up until the new version we never visualized this information in a central location. This has changed with the new UI – we now generate pretty pie charts, almost instantly usable in your favorite presentation software.

Pretty pies !

There are other new features in the UI – just give it a spin. After all, BinDiff is now directly available from our website and the price has been lowered to just 200 USD!

zynamics acquired by Google !

March 1st, 2011

We’re pleased to announce that zynamics has been acquired by Google! If you’re an existing customer and do not receive our email announcement within the next 48 hours, please contact us at info@zynamics.com. All press inquiries should be sent to press@google.com.

How to config the Win32 Kernel Debugger

February 24th, 2011

As mentioned here, one of the new features of the upcoming BinNavi 3.1 release, is the Win32 kernel debugger. This debugger enables you to perform dynamic analysis of Win32 kernel components. In this blog post I will describe how to configure your work environment to use the new debugger for BinNavi.
To debug kernel components with BinNavi, it is necessary to have a host system which runs BinNavi with the kernel debugger and a virtual machine which runs the code you want to analyse.
There are two ways for connecting your debugging system with the debugger. The first one is to use Virtual KD, which is the fastest solution, and the second one is to use the more generic, but slower WinDBG named pipe method.
It is recommended to use a virtual machine in combination with Virtual KD. Although other configurations are possible, they should only be chosen if Virtual KD can’t be used.

Configuration with Virtual KD

For this you need to install Virtual KD on the host system and on the guest vm, which will be used for debugging. After you downloaded the package and copied the target/vminstall.exe to your vm, you install Virtual KD by running the executable. Press the install button after checking if the parameters match the ones in the screenshot.

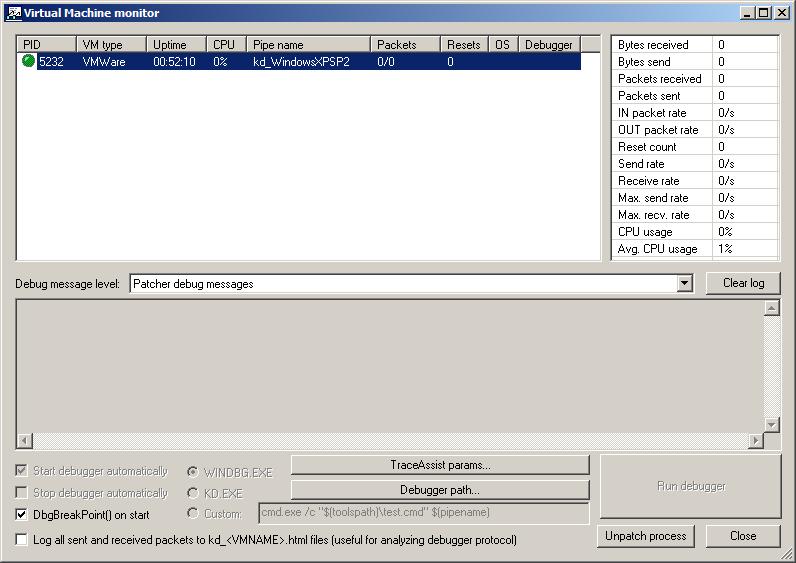
Now you can start the virtual machine monitor vmmon.exe (included in Virtual KD) on the host system and restart the debug virtual machine. The virtual machine monitor shows the pipename which is automatically created by the virtual monitor and is later used by the kernel debugger.

Configuration without Virtual KD

An alternative method is to use the standard com port via named pipes method in combination with vmware or a physical machine.

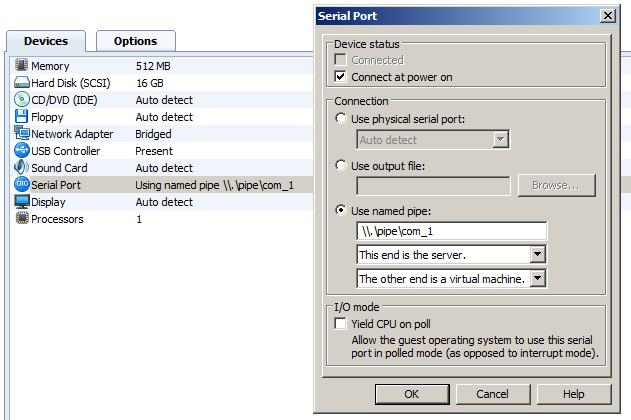
In case of using vmware, you need to go the settings of your virtual machine and add a new hardware. Choose as hardware ‘serial port’ with the name as ‘\\.\pipe\com_1’ and as additional options ‘This end is the server’ and ‘The other end is an application’.

Now you can start the virtual machine and edit the boot option to run the virtual machine with the debug option. These settings depend on your operating system:

For Windows XP:

You have to edit the boot.ini file of your virtual machine. For this you have to append the following line to your configuration file: ‘/debug /debugport=com1/baudrate=115200’.

If you want to do debug a physical machine you may want to change this parameter to suit your needs.

multi(0)disk(0)rdisk(0)partition(1)\WINDOWS="normal boot" /noexecute=optin /fastdetect
multi(0)disk(0)rdisk(0)partition(1)\WINDOWS="debug boot" /noexecute=optin /fastdetect /debug /debugport=com1 /baudrate=115200

You must reboot your vm for the changes to take effect.

For Windows Vista and Windows 7:

You have to use the bcedit command to change the boot option:

At first start a cmd shell with admin privileges, then use the following command to get the ID

bcdedit /v

then make a copy of the normal entry:

bcdedit /copy {ID} /d "kernel debug"

and enable kernel debug on it with the following command:

bcdedit /debug {ID} on

You must reboot your vm for the changes to take effect. For more information please have a look at
http://www.microsoft.com/whdc/driver/tips/Debug_Vista.mspx

Configuration in BinNavi

The next step is to load your device driver using the usual step into the BinNavi database. This procedure is explained in more detail here. After the module is successfully loaded, you have to create a new debugger and assign it to the module. The default port is 2222 which can be changed. After this is done you can run the windbg debug client using the command line:

windbgclient32.exe -p 2222 com:port=\\.\pipe\kd_WindowsXPSP2,baud=115200,pipe

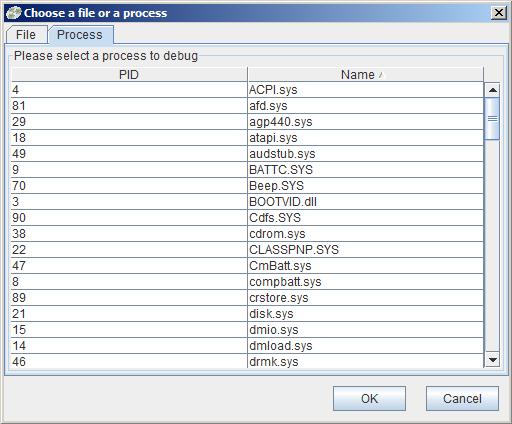
This results in listening on the default debug port and connecting to the name pipe ‘kd_WindowsXPSP2’. Now you can open the module in BinNavi by selecting a call graph or flow graph and switch to the debug view (crtl+d). To connect to the selected debugger just press the start debugger button and wait until the debugger is loaded. In the last step you have to choose the right device driver you want to debug in the dialog.

After all steps are done you can start with your normal work flow to analyse the module. This includes using the trace mode for differential debugging and setting breakpoints on interesting functions.
Happy debugging!

VxClass 1.5

February 15th, 2011

Today, we release a new version of our malware clustering solution: zynamics VxClass 1.5[1].

Compared to the previous release (VxClass 1.3)  and aside from fixing tons of bugs, we improved version 1.5 with new and upgraded system software, updated the BinDiff-based differ component and finally switched to IDA Pro 6.0.

Here are some more things we changed:

  • Updated the base system to the new Debian 6.0 (“Squeeze”)
  • Upgraded to Python 2.7.1 for VxClass base code
  • Upgraded to IDA Pro 6.0 and IDAPython 1.4.3, pefile 1.2.10-96
  • Updated the diffing engine to the newest BinDiff version
  • Performance improvements when using VxClass in a cluster
  • Huge performance improvements: A single machine can now easily process 8000 samples a day.
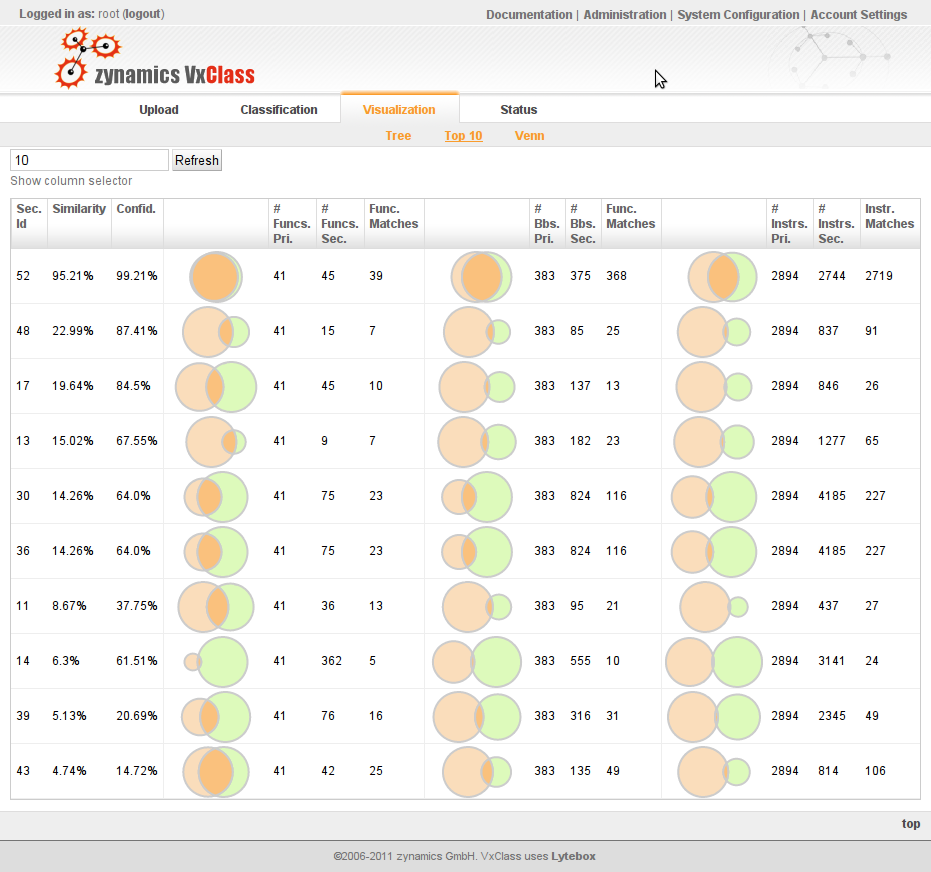
  • New top-10 most similar visualization (more below)

And of course this release also includes the signature generation component Thomas blogged about here, here and here.

With improved performance, mining the data of a VxClass system that contains tens of thousands of malware samples provides more and more insight. Unfortunately, up until now, this has been more difficult than necessary. For example, answering questions like “What are the 10 most-similar malware samples for this particular sample?” usually meant writing custom Python scripts that access the built-in XMLRPC interface.
Starting with this release, we will continue to add more visualization options for the data in the system. We start off simple with the top 10 most-similar and Venn diagram visualizations.

Showing the top 10 most-similar samples for a malware binary

When using the “family tree” applet that has been present in VxClass since the first release, another “caveat” of being able to process tens of thousands of samples becomes apparent: humans cannot visually process several thousand clusters organized in a graph. Thus, the next release will contain an alternate visualization for the “family tree”. I’ll leave the details to another blog post.

All existing customers within their support periods will receive an e-mail regarding the upgrade in the next few days.

[1] Following the naming tradition of Ubuntu, VxClass releases are code-named with an alliteration. This release is code-named “exploited emu” which follows after version 1.3’s “malicious monkey”.

BinDiff 3.2.1… fun!

February 1st, 2011

Hi there. I am one of the developers working on VxClass and the signature generation component in particular. However, working in a small company such as zynamics also means I get to do tons of other stuff, like preparing installer packages and other behind-the-scenes work.
So, in my first post I have the pleasure to announce a new version of our binary comparison tool: BinDiff 3.2.1. As the version number implies, this is mostly a bugfix only release, but with one important difference: As of now, all customers that place an order for BinDiff, automatically receive Debian GNU/Linux packages as well as the familiar Windows Installer package. Supported Debian-based distributions include:

  • Debian 5.0 (“Lenny”)
  • Ubuntu 10.04 LTS (“Lucid Lynx”)

Please note that for the Linux packages, we only support using BinDiff with Hex-Rays IDA Pro 6.0. For the Windows version we support the three latest versions of IDA Pro (5.6, 5.7 and 6.0, respectively).

This is how BinDiff looks on Linux:

BinDiff 3.2.1 in IDA 6.0 (Qt) on Linux

BinDiff 3.2.1 GUI on Linux

You can order BinDiff over the usual channels: e-mail, the order form on our web site or your favourite reseller.

This concludes my first post here, have fun diffing!

Memoryze + VxClass vs Zeus

January 27th, 2011

I have previously blogged about VxClass and our algorithms for automated generation of byte signatures here and here and here. I have also blogged about private signatures beforehand, a concept that I think has great relevance for defense against (and response to) targeted attacks. One point I left open in the previous blog post was the following question:

How do I actually use the byte signatures in a real-world scenario?

In this post, I will answer that question: We will use the latest version of Mandiant’s Memoryze and VxClass and walk through the entire process of memory acquisition, malware classification, signature generation and signature deployment. In detail, our steps are going to be the following:

  1. We will pre-populate a VxClass system with a good quantity of Zeus samples
  2. We will examine the clusters generated from this
  3. We infect a previously clean XP with a new Zeus sample
  4. We identify the suspicious memory sections that were created by Zeus using Memoryze and AuditViewer, two great (and free!) tools that Mandiant has released
  5. We acquire the injected memory sections from the infected system and submit them to VxClass
  6. VxClass recognizes the similarity to previously submitted Zeus samples and generates a byte signature to detect the entire cluster of both old and new Zeus variants. This signature is unique to us, and can be used to detect infections by this malware on any Windows machine.
  7. The signature is then fed into Memoryze to identify the infection on other machines

Wow, that’s quite a list. So where do we start? We start out by examining a small set of about 180 malware samples that we pre-populated a fresh VxClass with. These samples were labeled “Zeus” or “Zbot” by some anti-virus software, so we assume they are Zeus variants.VxClass has generated family trees, and assigned most of the files to these trees.
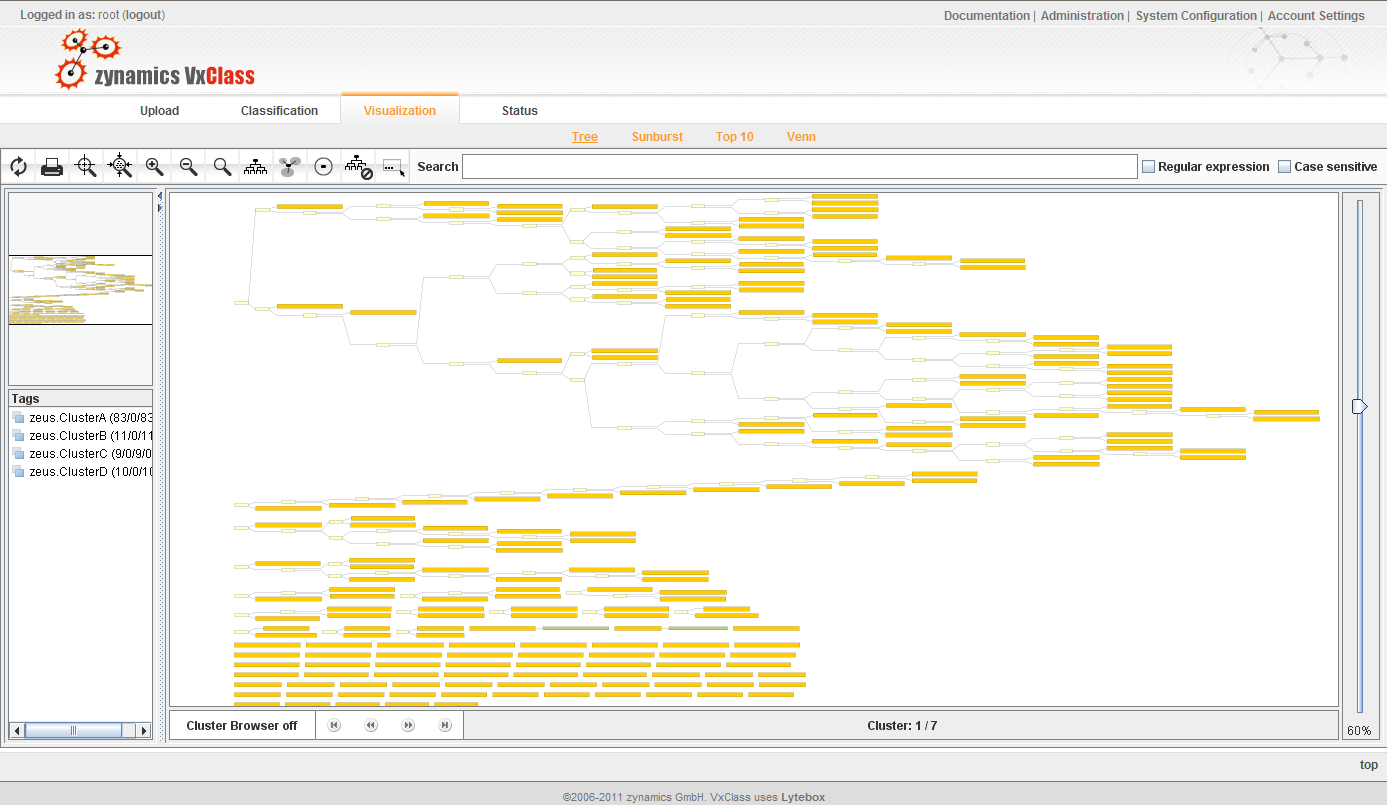
An overview of the family trees in the system

In the next two pictures, it will become evident what the “similarity score” between two samples means: It indicates how much overlap there is between the code of the two executables under consideration. To further illustrate the issue, we drew some Venn diagrams illustrating the overlap between the highlighted samples on the right hand side.
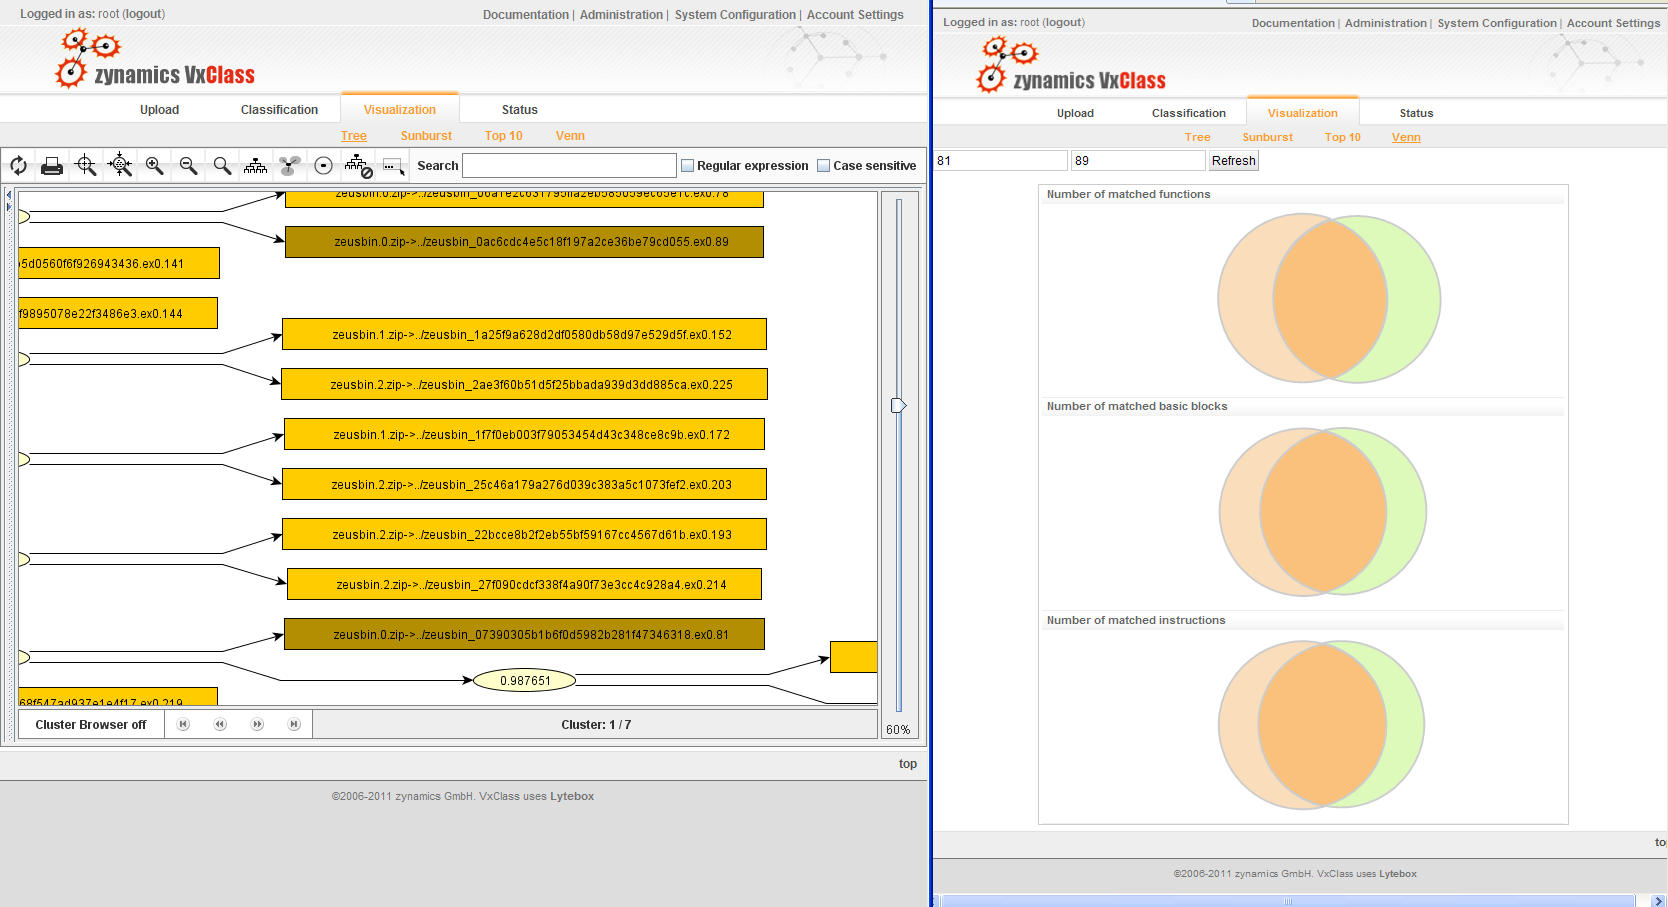
Two pieces of malware and how they overlap

The next screenshot shows where in the family tree these two items are located (you might have to load the non-thumbnail version to actually see this):
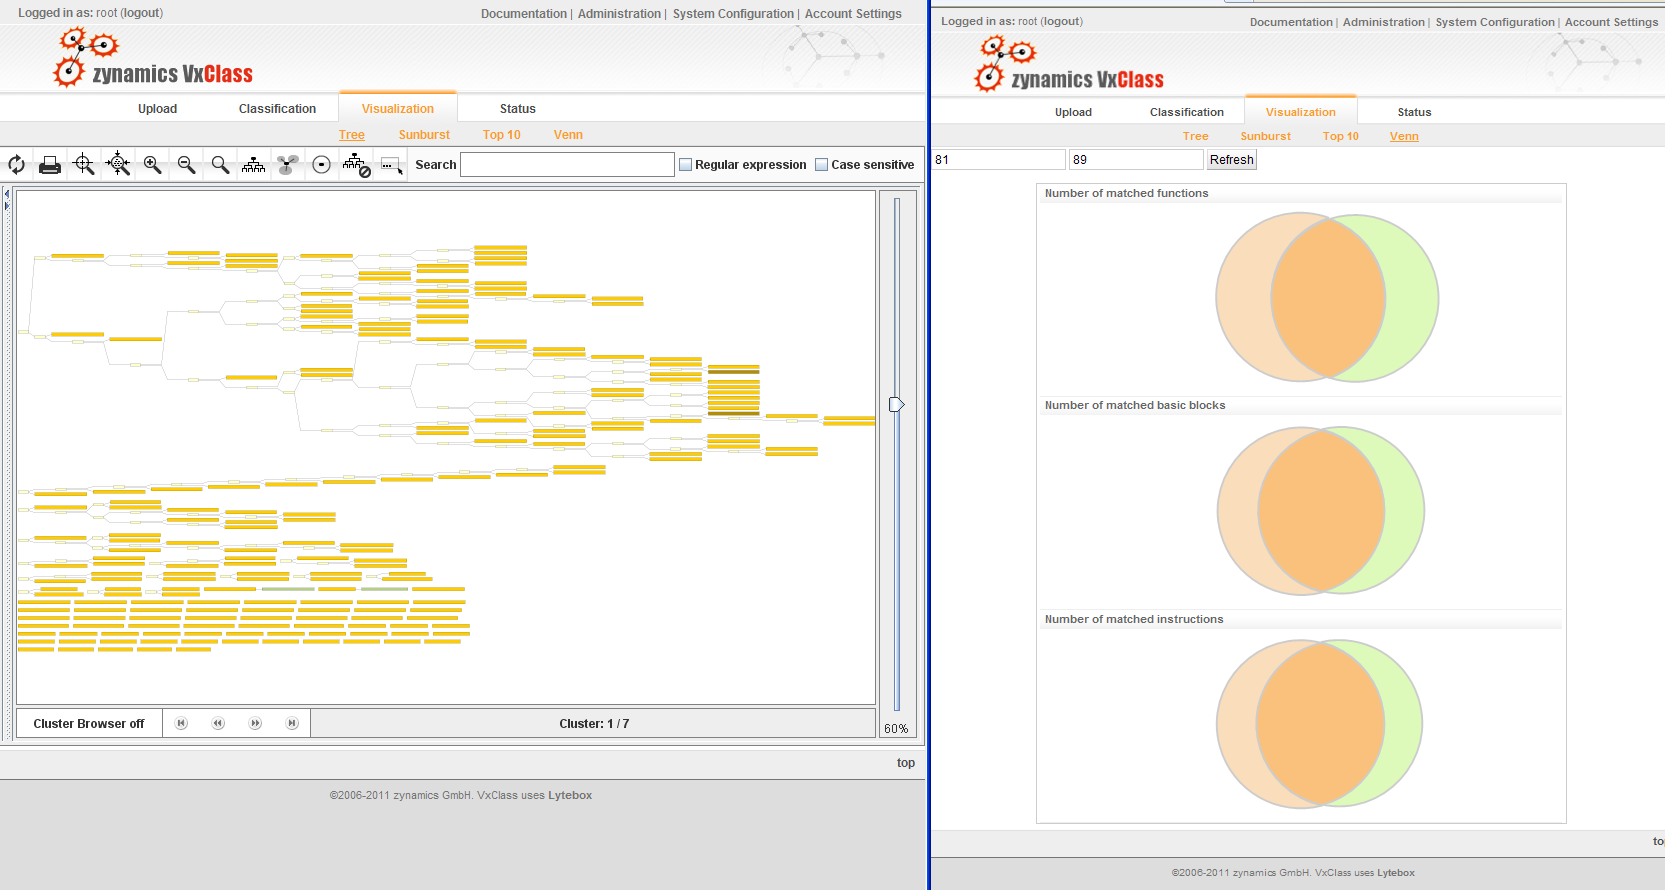
But enough of this. As a next step, I infect a vanilla XP machine with a new random sample that was labelled Zeus — one that VxClass has never seen before. After having done this, I use Memoryze (and AuditViewer, a nice GUI for it) to identify the memory sections that have been injected into various processes. To do this, you have to click through a few dialogs that ask you to configure the following things:

  1. The location of Memoryze
  2. The output path for the data
  3. Whether you wish to work from live memory (yes)

In the first step, we just want to identify those processes that Zeus injected itself into – we will acquire the injected memory separately. We hence check “Process Enumeration” and leave the “Acquisition” fields unchecked. Finally, we enable “Memory Sections” and “Detect Injected DLLs” to be enumerated for each process. AuditViewer now launches Memoryze, and after a brief waiting period we can inspect the results. AuditViewer is nice enough to highlight the processes that contain suspicious injected DLLs in red. Furthermore, we can immediately spot the problematic section of memory, because AuditViewer has highlighted it, too.
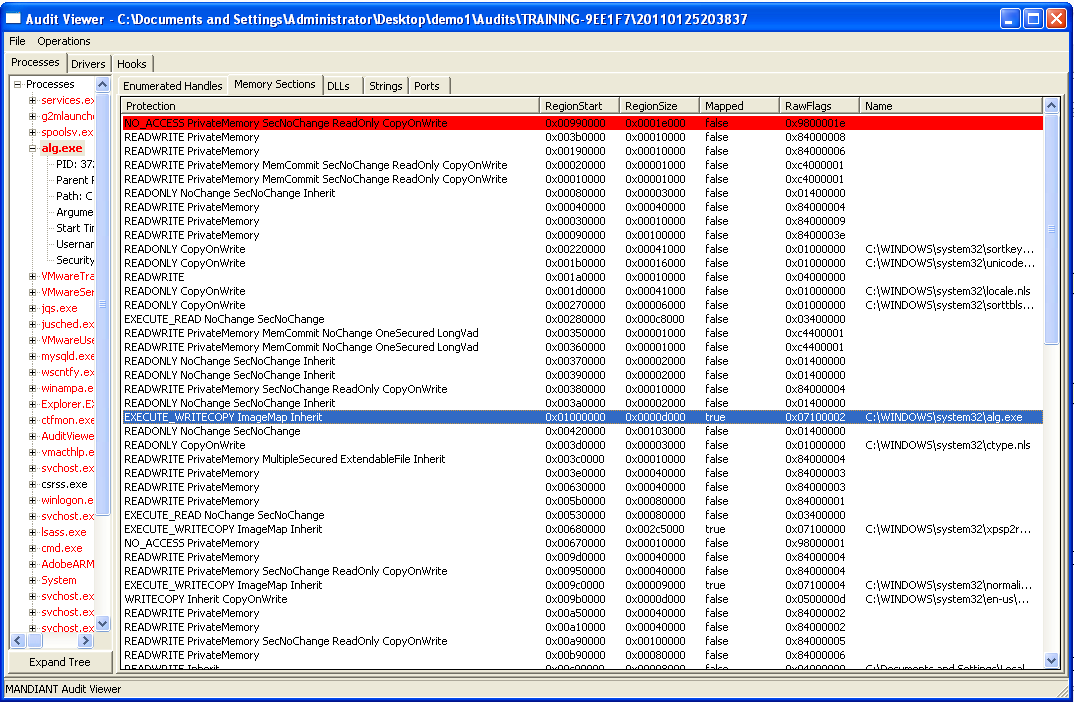
AuditViewer highlights the suspicious memory regions

In the next step, we simply upload the .VAD file of this memory section to our VxClass box and look whether this is in any way similar to the code already in the box. And no surprise: It is quite similar to a number of other executables in the database:
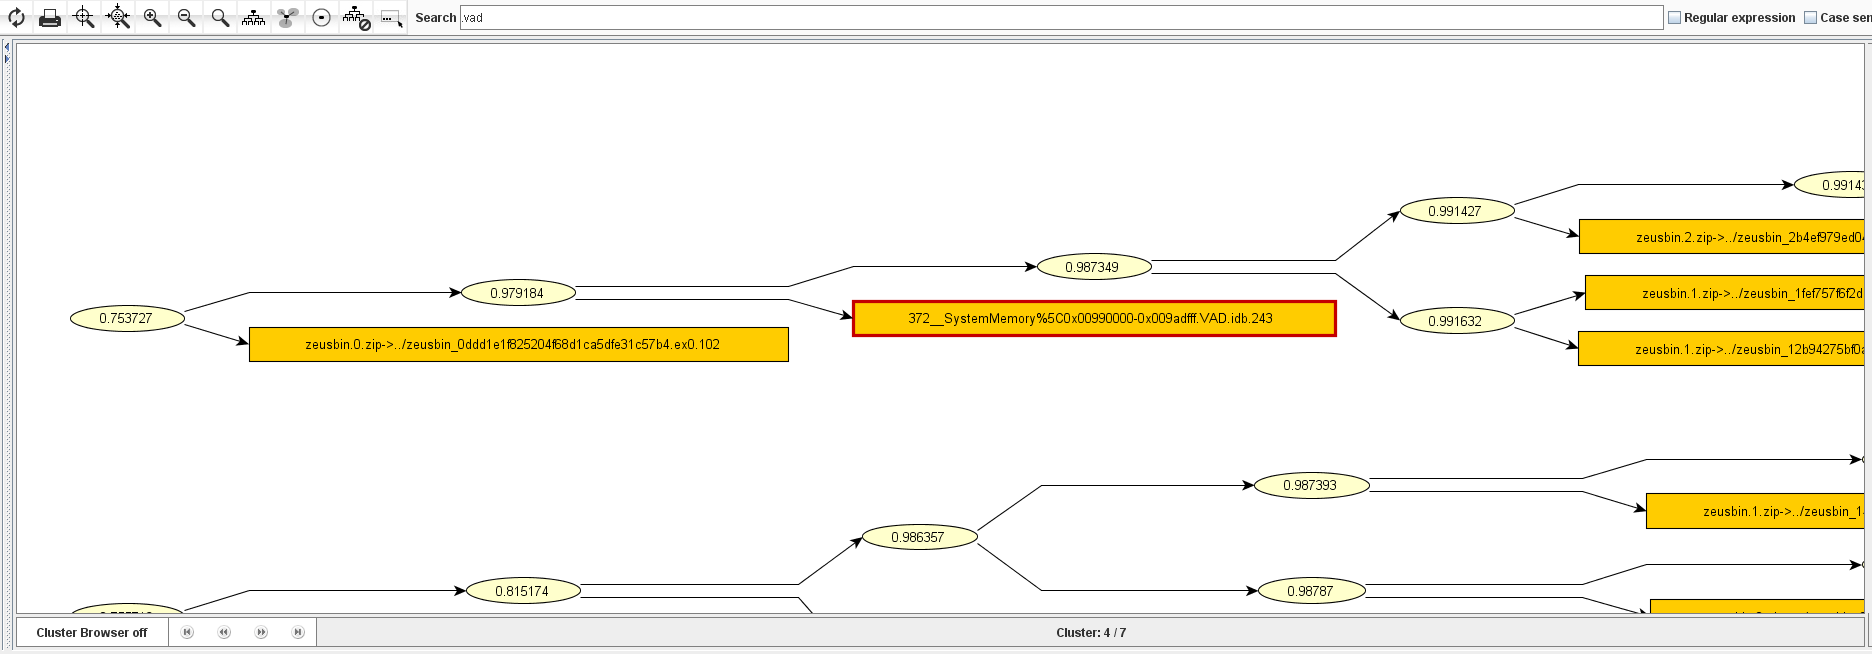
The .VAD file was clustered close to other executables

In the next step, we will want to generate a traditional byte signature for all executables in the relevant cluster. This is pretty easy — highlight them, assign a tag to them, and then right-click “create signature” (screenshot below).
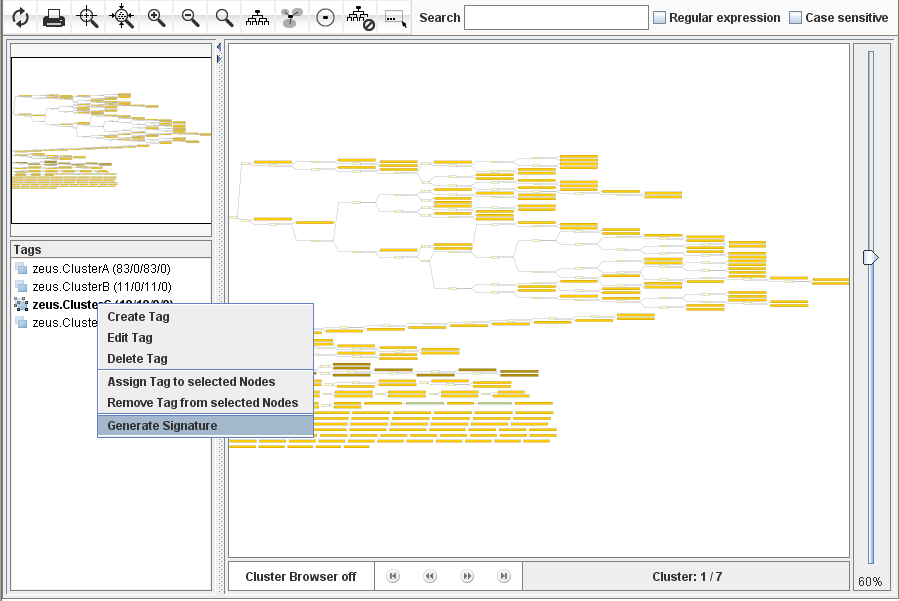
Making VxClass generate a signature automatically

A few seconds later, the signature is ready and can be downloaded (in ClamAV format) from the “Signatures” tab in the VxClass web UI. The generated signature is the following:

cluster.C.worm:0:*:81ec*000000*8b75*ff75*
56ff15*0033*8945*0f84*558bec83ec10565733f668*
0033ff8975fcff15*0033c08945f4393d*0076*463b35*
0072c7*8b7d*8b7d08e8*837d*007413*ff7608e8*
feffff8bc889*85c9*3c20740b*013845fe7444*
c645fe00e9e1000000*558bec81ec*020000*535633*
0000*0033*8d85*fdffff*5089*ff15*8d85*b301*
83f907750d*0085c075*6a07585068*8b7d188d043b8d440014*
8bf08975*020000*8365*00566a0033c0c645ff00e8*
06000085c00f85*010000*0fb645fd0fb70cc5*008b3d

This is clearly much longer than what would be strictly required – we usually generate much longer signatures than the bare minimum in order to minimize the risk of false positives. The cool thing about the signature is that it is private — e.g. no other user of VxClass would get the same signature (to be precise: the probability of another user getting the same signature is astronomically small). This means that unless you share this signature (like I did above), it remains as a “secret weapon” in your arsenal: The malware authors do not know what signature you are going to detect them with, so they can’t intentionally “break” this signature.

Now, an important question remains unanswered:

How does one deploy such a signature?

We have two options: We can use AuditViewer to configure Memoryze again, or we can simply run Memoryze from the command line with the appropriate configuration file to scan through the physical memory of a machine. In order to use AuditViewer, simply configure it as usual: Provide it with the location of Memoryze and tell it to analyze live memory. After you have done so, you mark the “enumerate processes” checkbox, and finally, you tell AuditViewer about the byte pattern you wish to search for:
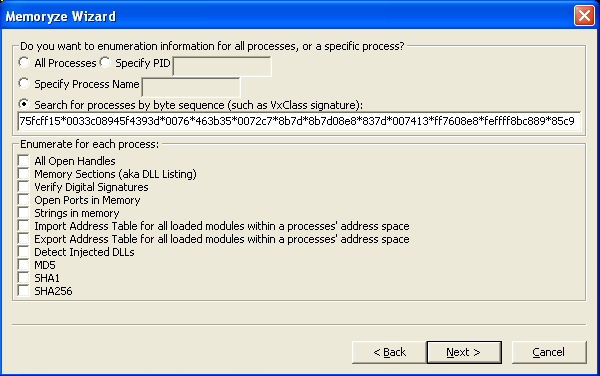
Configuring AuditViewer to scan for a signature

AuditViewer will then launch Memoryze in the background which will scan through all processes and identify those that contain the pattern in question.

AuditViewer saves the current configuration for Memoryze in a file called out.xml in your Memoryze directory. This means you can simply make a copy of out.xml in your Memoryze directory and re-use it on other machines without having to re-run AuditViewer. Simply install Memoryze on a machine and then launch “Memoryze -script out.xml -o <outputdir>“.

You now have a new way of detecting variants of the malware that was used to attack you. But best of all: This method is secret – the signature isn’t shared with the wider world – and the attacker therefore has a much harder time immunizing his attack tools prior to the next attack.

To summarize: Combining VxClass with Memoryze and AuditViewer makes the acquisition and correlation of malicious code easy – but best of all, these tools also provide a quick and convenient way to automatically generate high-quality detection mechanisms that are kept secret from the attackers.
Recovering UML diagrams from binaries using RTTI – Inheritance as partially ordered sets

January 21st, 2011

Wow, it’s been a while since we last blogged. Ok, time to kick off 2011 🙂

A lot of excellent stuff has been written about Microsoft’s RTTI format — from the ISS presentations a few years back to igorsk’s excellent OpenRCE articles. In the meantime, RTTI information has “spread” in real-world binaries as most projects are now built on compilers that default-enable RTTI information. This means that for vulnerability development, it is rare to not have RTTI information nowadays; most C++ applications come with full RTTI info.

So what does this mean for the reverse engineer ? Simply speaking, a lot — the above-mentioned articles already describe how a lot of information about the inheritance hierarchy can be parsed out of the binary structures generated by Visual C++ — and there are some pretty generic scripts to do so, too.

This blog article is about a slightly different question:

How can we recover full UML-style inheritance diagrams from executables by parsing the RTTI information ?

To answer the question, let’s review what the Visual C++ RTTI information provides us with:

  1. The ability to locate all vftables for classes in the executable
  2. The mangled names of all classes in the executable
  3. For each class, the list of classes that this class can be legitimately upcast to (e.g. the set of classes “above” this class in the inheritance diagram)
  4. The offsets of the vftables in the relevant classes

This is a good amount of information. Of specific interest is (3) — the list of classes that are “above” the class in question in the inheritance diagram. Coming from a mathy/CSy background, it becomes obvious quickly that (3) gives us a “partial order”: For two given classes A and B, either A ≤ B holds (e.g. A is inherits from B), or the two classes are incomparable (e.g. they are not part of the same inheritance hierarchy). This relationship is transitive (if A inherits from B, and B inherits from C, A also inherits from C) and antisymmetric (if A inherits from B and B inherits from A, A = B). This means that we are talking about a partially ordered set (POSet)

Now, why is this useful ? Aside from the amusing notion that “oh, hey, inheritance relationships are POSets“, it also provides us with a simple and clear path to generate readable and pretty diagrams: We simply calculate the inheritance relation from the binary and then create a Hasse Diagram from it — in essence by removing all transitive edges. The result of this is a pretty graph of all classes in an executable, their names, and their inheritance hierarchy. It’s almost like generating documentation from code 🙂

Anyhow, below are the results of the example run on AcroForm.API, the forms plugin to Acrobat Reader:

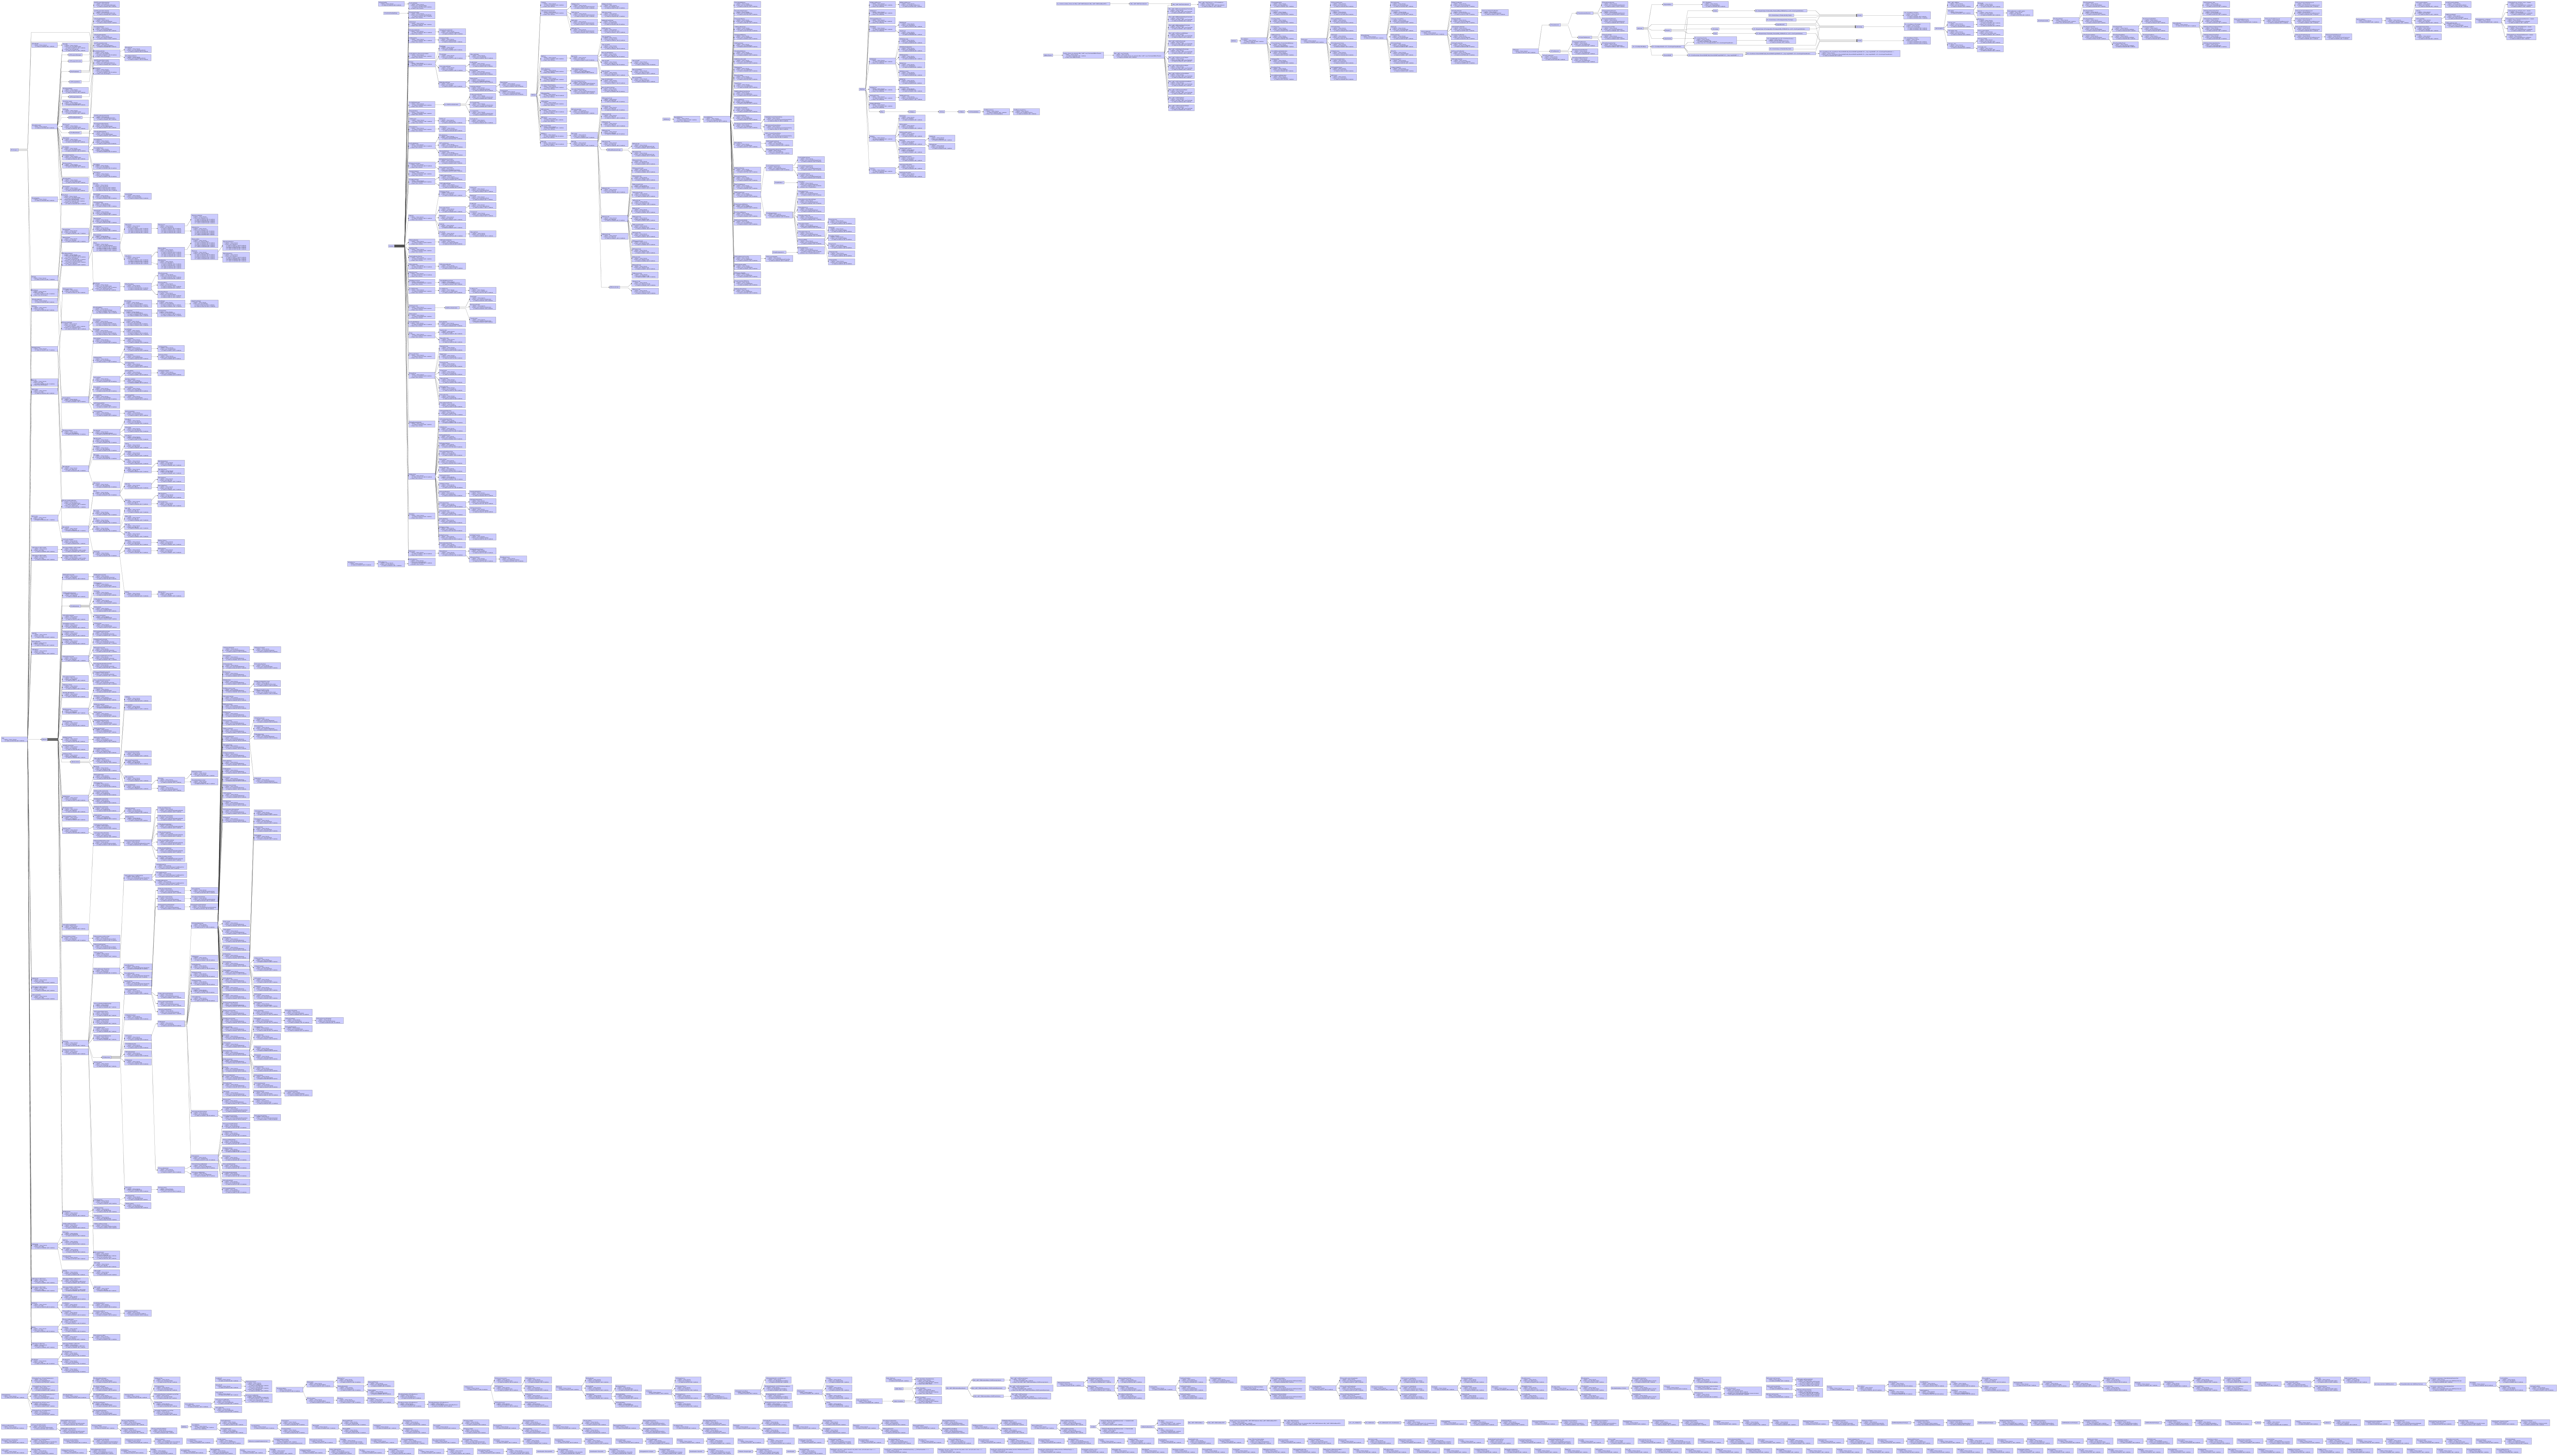
The full inheritance diagram of all classes in AcroForm


A more interactive (and fully zoomable) version of this diagram can also be viewed by clicking here.

For those of you that would like to generate their own diagrams, you will need the following tools:

Enjoy ! 🙂

BinDiff 3.2.0 released

September 17th, 2010

We are pleased to announce the official BinDiff 3.2.0 release. zynamics BinDiff is the leading comparison tool for binary files, that assists vulnerability researchers and reverse engineers all over the world to quickly find differences and similarities in disassembled code. BinDiff uses a unique graph-theoretical approach to compare executables by identifying identical and similar functions, which is resilient even against changes in binaries introduced by different compilers and optimization settings.

With BinDiff one can conveniently identify and isolate fixes for vulnerabilities in vendor-supplied patches. One can also port symbols and comments between disassemblies of multiple versions of the same binary or gather evidence for code theft or patent infringement. BinDiff 3.2.0 compares binary files for x86, MIPS, ARM, PowerPC, and any other CPU architectures supported by IDA Pro. BinDiff displays function matches between two binaries in a clear way and easily ports function names, anterior and posterior comment lines, standard comments and local names from one disassembly to another.

So, what are the new features in zynamics BinDiff 3.2.0? In a nutshell, besides many bug fixes and a better IDA integration, the quality of the diff engine has been improved. Also, this version is shipped with a new C++ based exporter plug-in for IDA which unifies the export process between BinNavi and BinDiff. For more information, refer to the previous blog post titled “BinDiff 3.2 public beta phase starts today“, or take a look at the complete change list, which can be found in the manual.

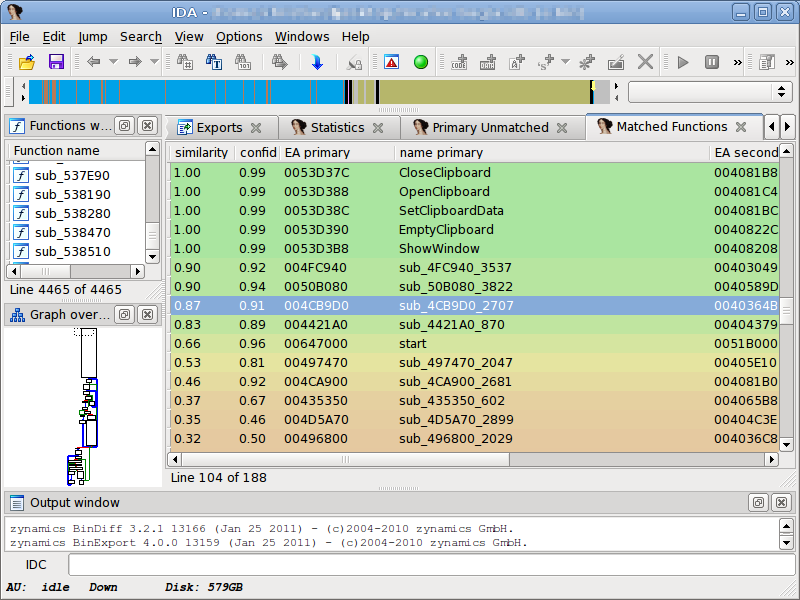
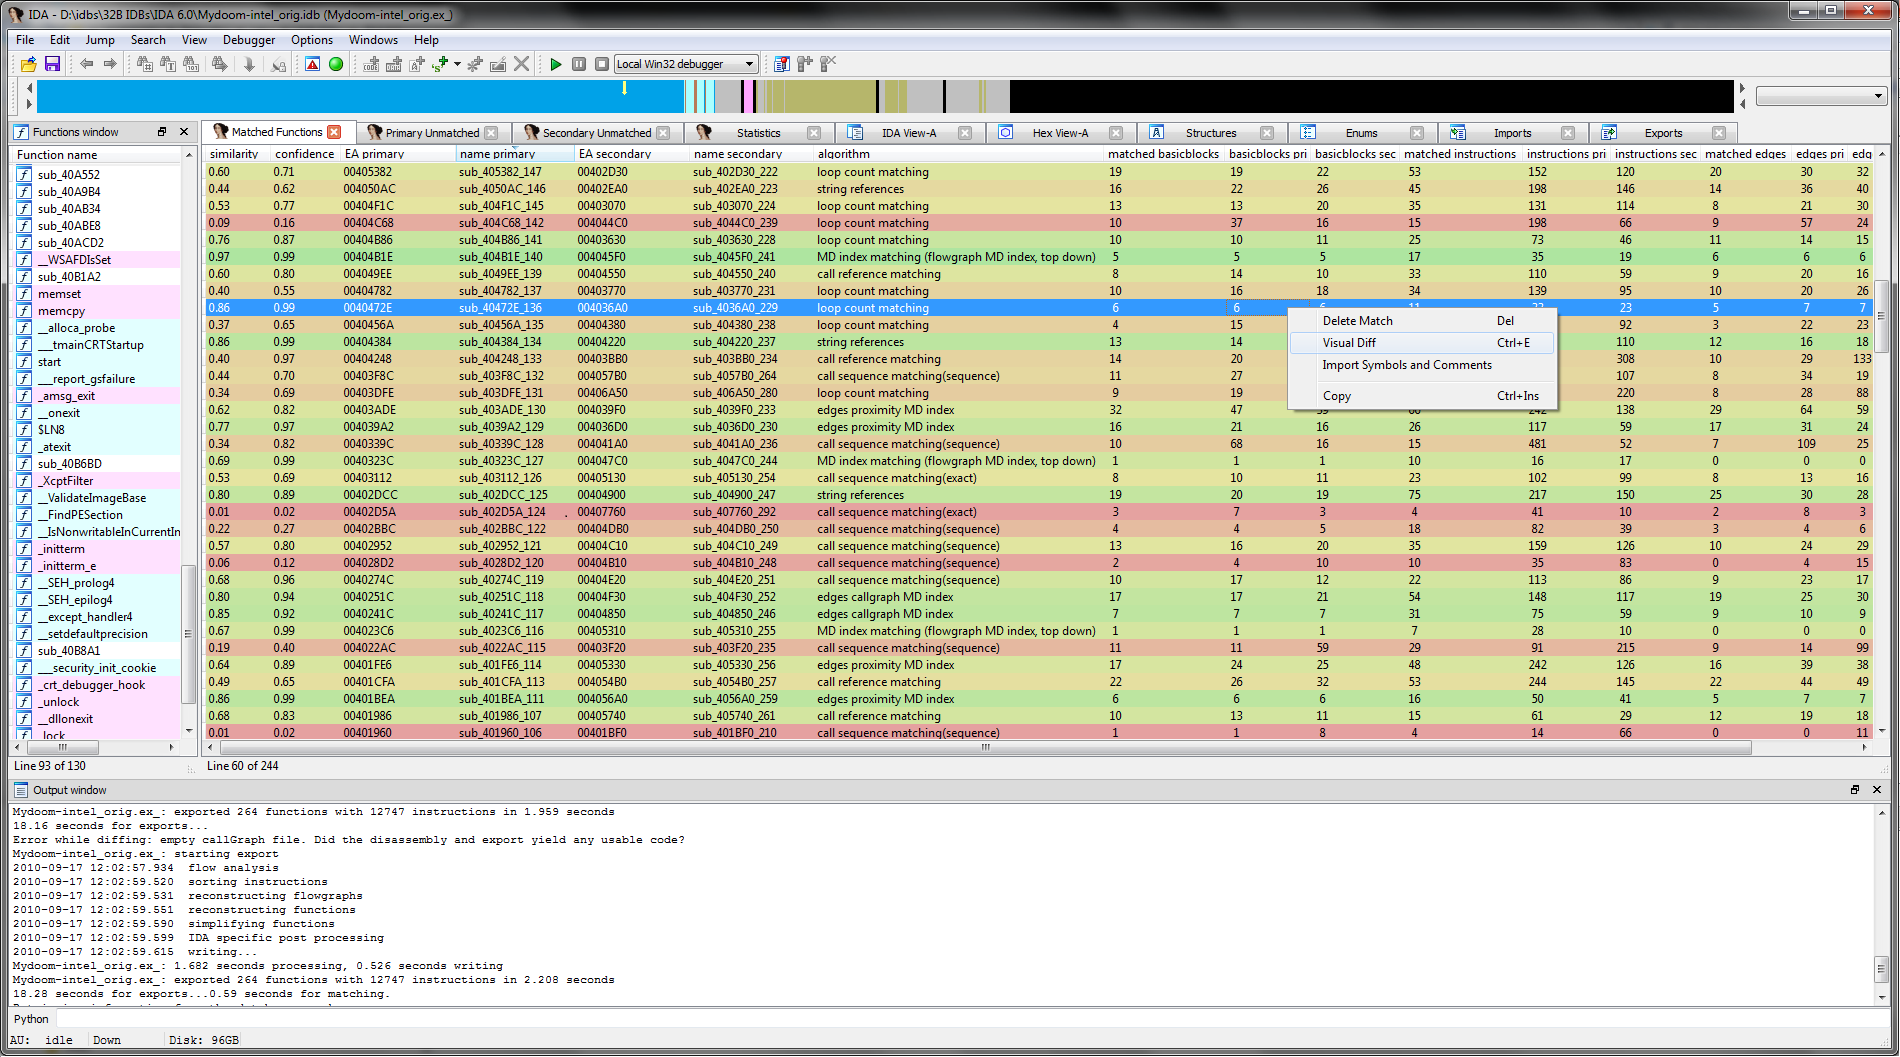
BinDiff’s new colored “Matched Functions” view in IDA Pro v6.0  Beta 3.

The previous image shows the new “Matched Functions” view with a diff of two MyDoom binaries that were build by different compilers and with different optimization settings. Each match is colored from green to red according to the respective similarity in both binaries.


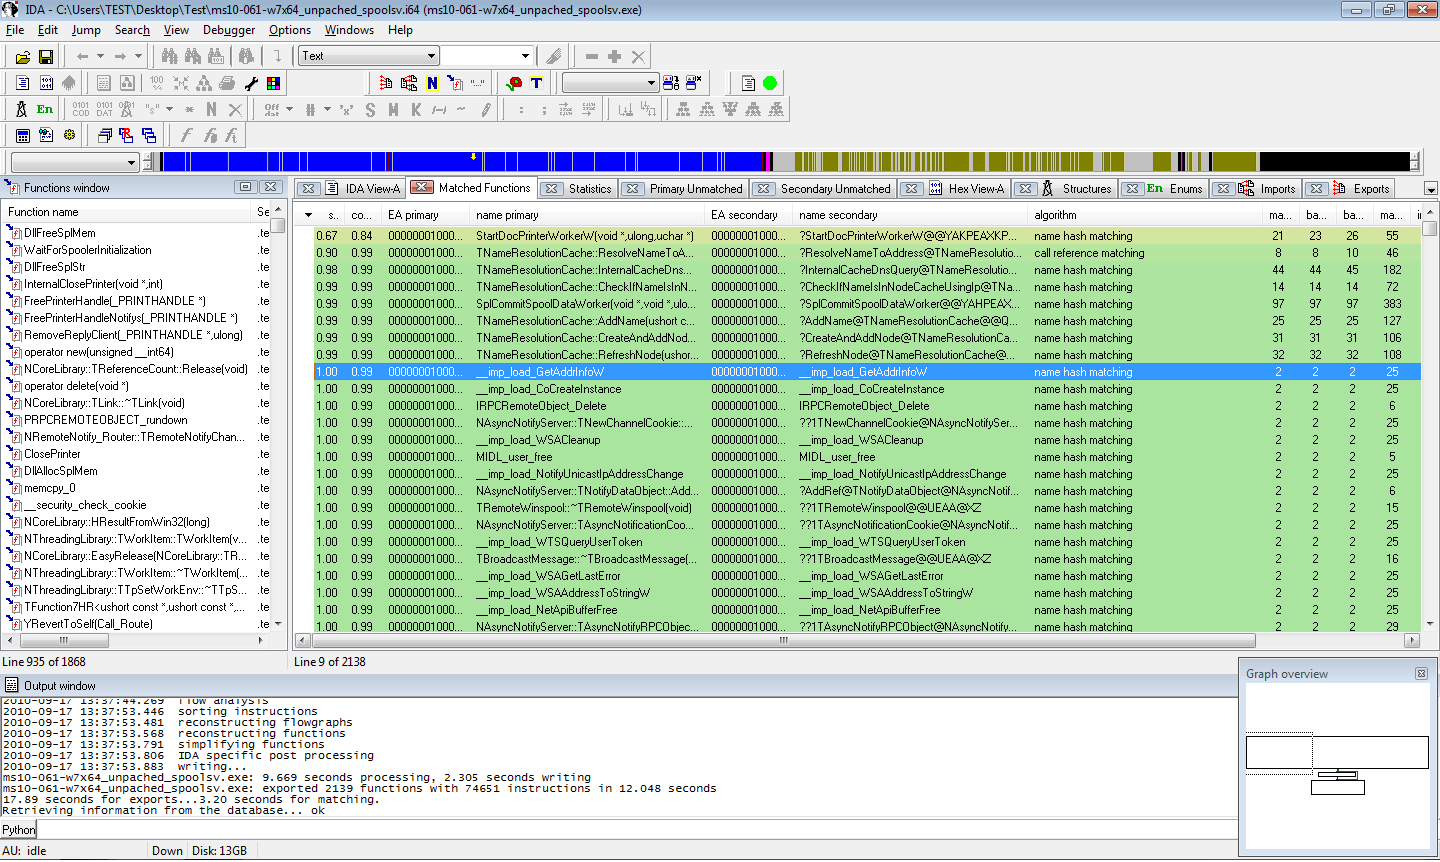
BinDiff’s “Matched Function” view in IDA Pro 64 6.0 Beta 3.

The image above shows the “Matched functions” view in IDA of a patch diff (MS-10-061 for Windows 7 x64). Changed functions can be easily spotted by sorting the table by similarity.

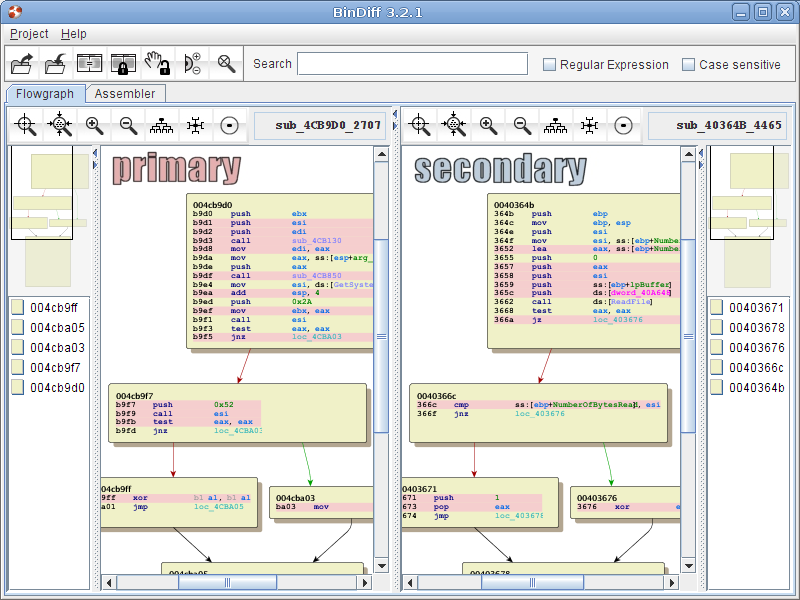
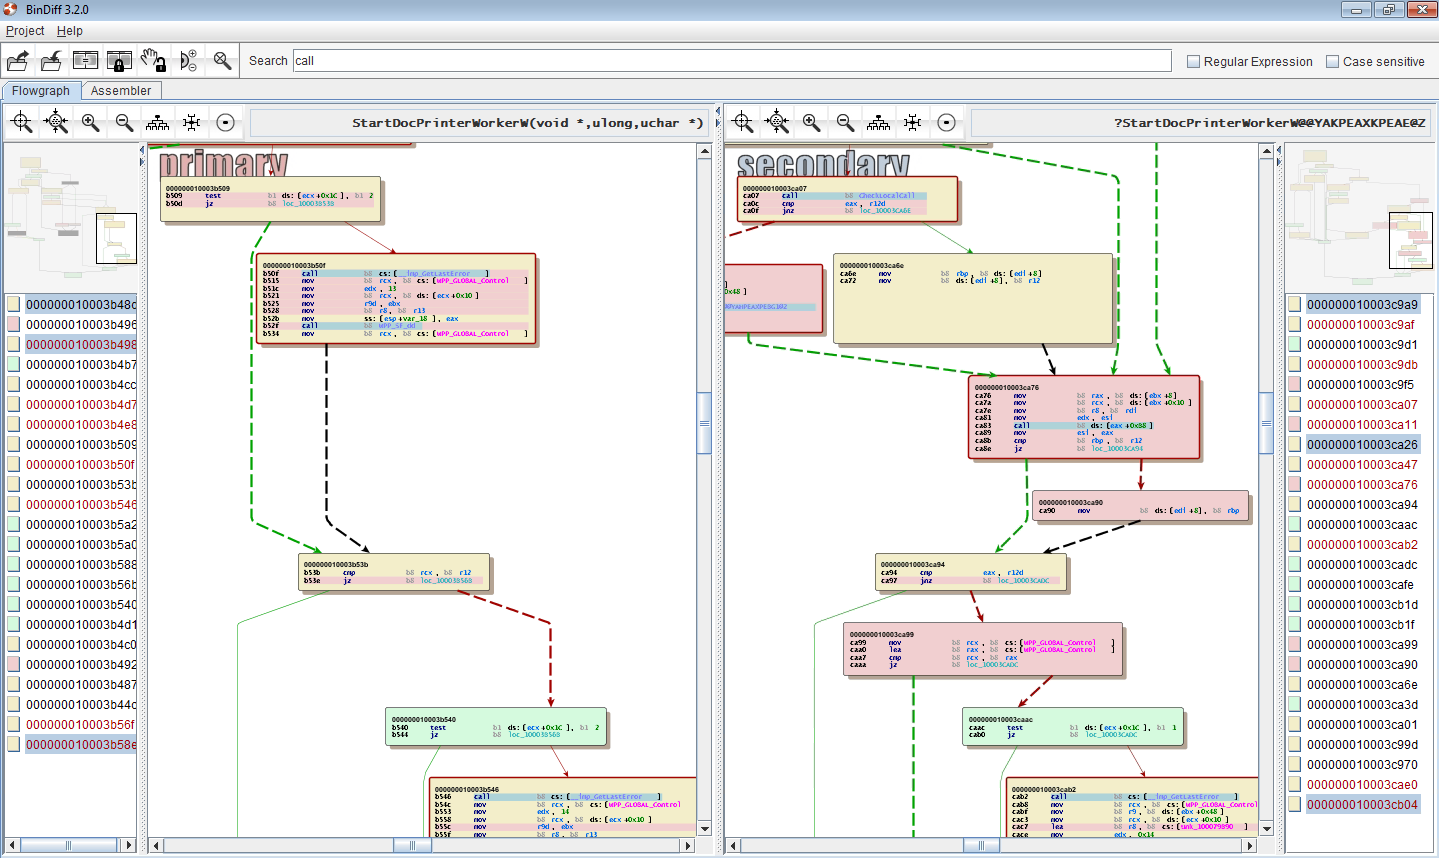
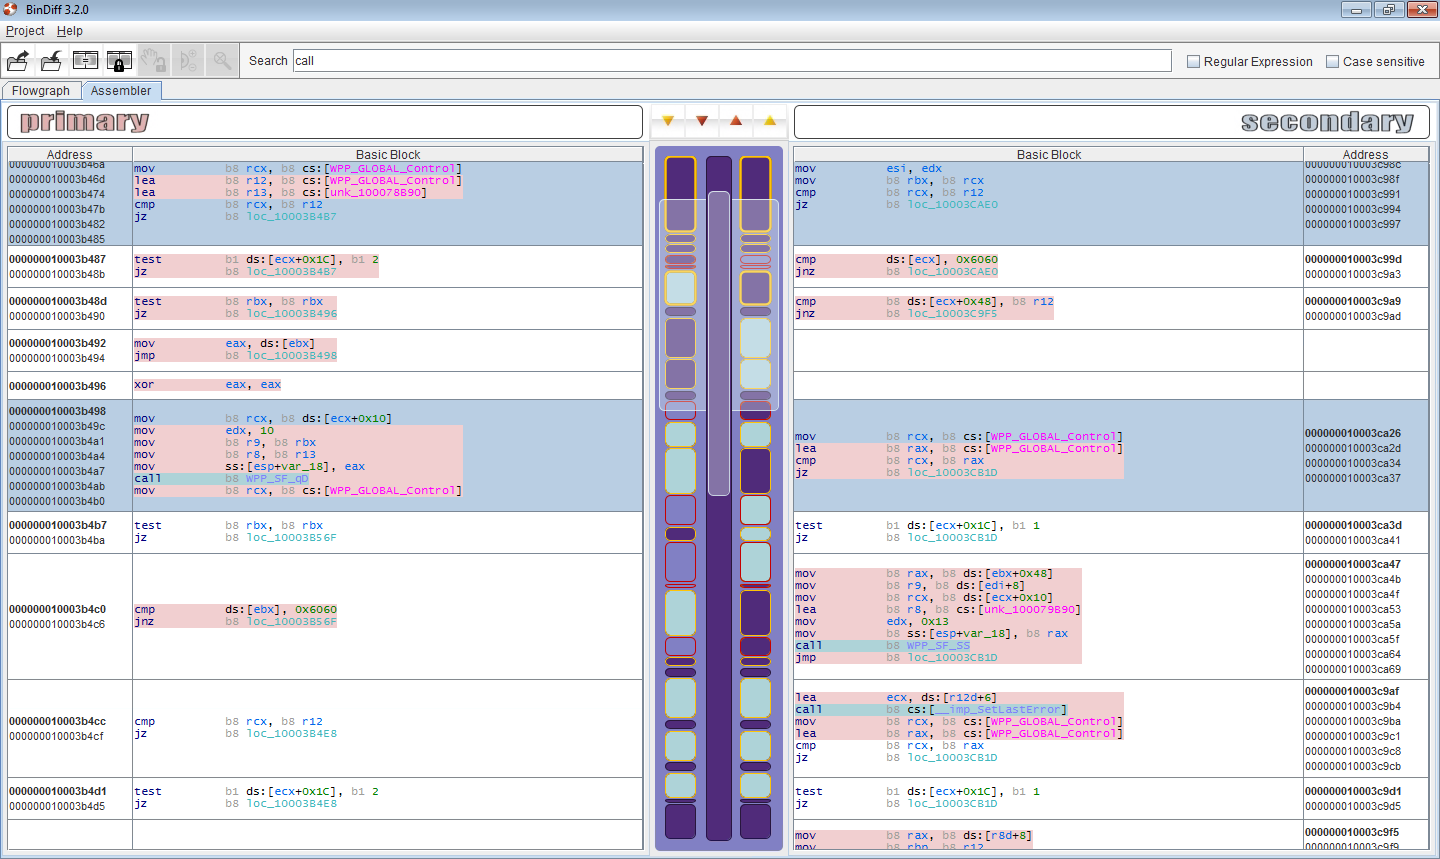
BinDiff's graph view of a single function diff.

BinDiff’s text view of a single function diff.

If you have any questions, please leave a comment or contact the zynamics support. If you are interested in a trial version, please write an email to info@zynamics.com. More screenshots and an order form can be found here.

PDF Dissector 1.7.0 released

September 3rd, 2010

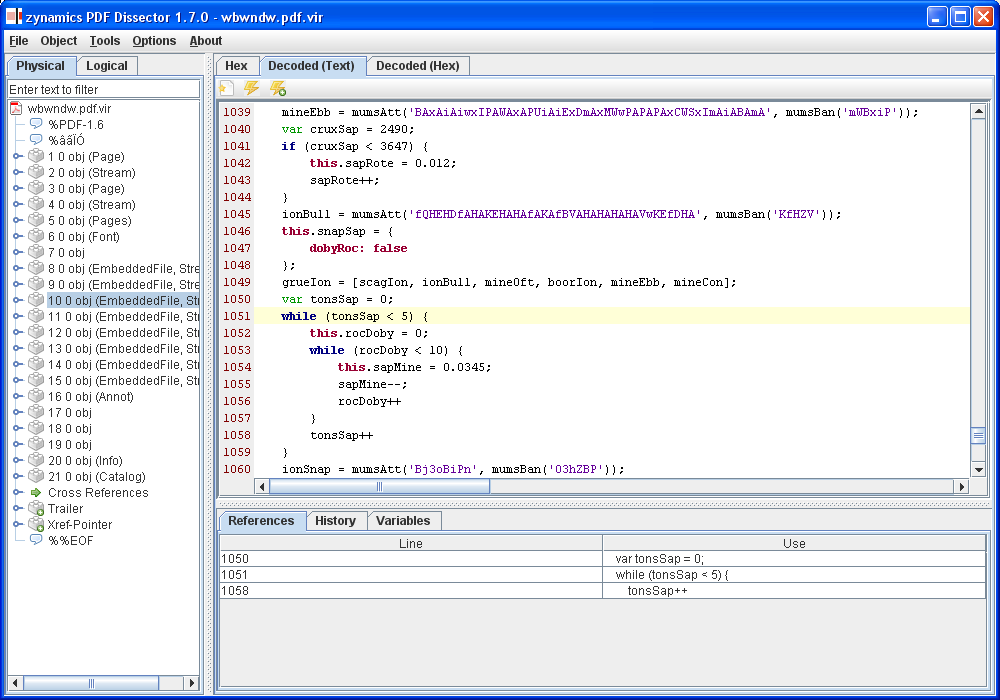
Today I analyzed a malicious PDF file that contained more than 1100 lines of heavily obfuscated malicious JavaScript code. To make it easier for me to deobfuscate the code, I added two new features to our PDF malware analysis tool PDF Dissector: Variable references and snapshot histories.

The variable references feature shows you where variables are used in JavaScript code. Just place the caret over a variable identifier and all lines that use that variable are shown to you. You can see what this feature looks like in the screenshot below.

Showing all uses of the variable tonsSap

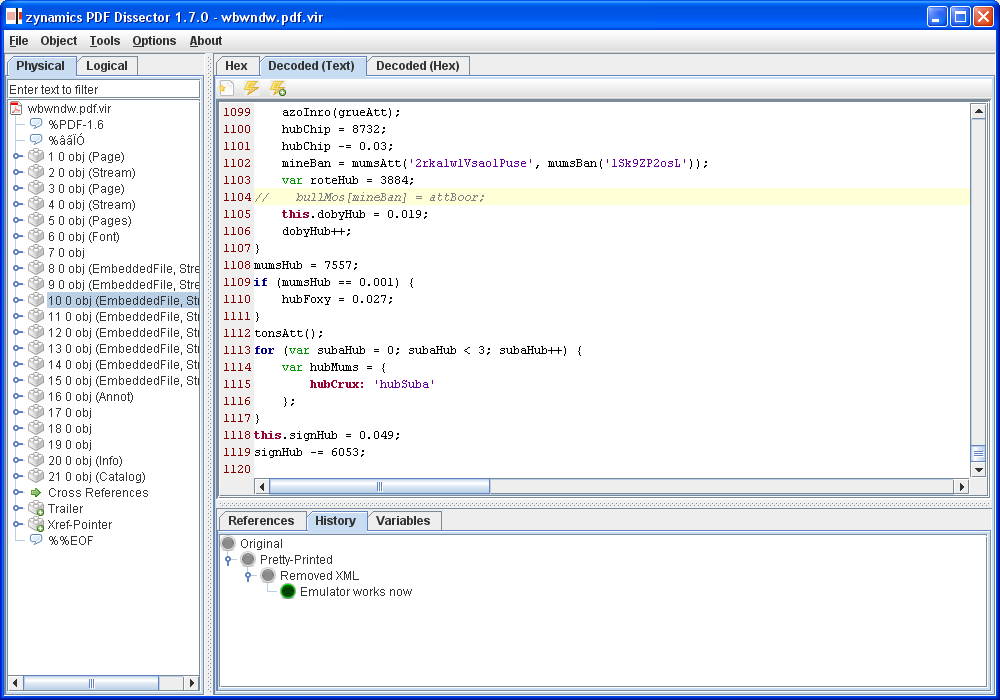
The snapshot history feature allows you to take JavaScript source snapshots of known states. Later on, you can then revert to the source code to the recorded snapshots. This is very useful when you accidentally remove JavaScript code that later turns out to be needed after all. The screenshot below shows you a snapshot tree of four named snapshots I made during different states of the deobfuscation process.

Snapshot history with four snapshots

To learn more about PDF Dissector, please visit the product site or the PDF Dissector manual.

PDF Dissector 1.6.0 released

August 30th, 2010

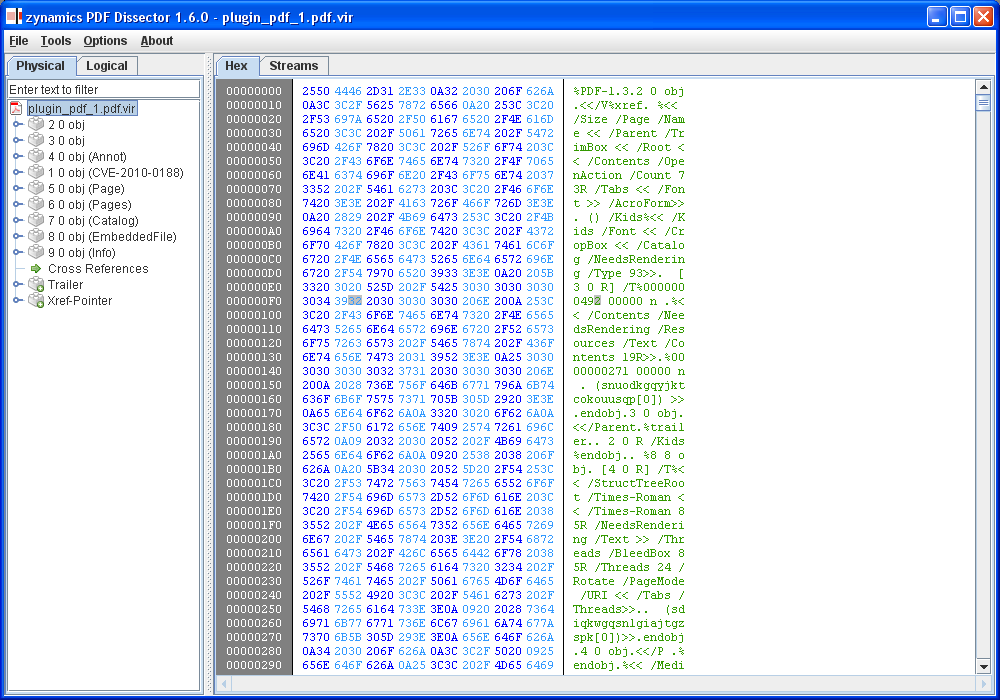
Today we are releasing a new version of our PDF malware analysis tool PDF Dissector. This release fixes two PDF parsing bugs reported by our customers. The first bug led to problems when PDF files were using unexpected null-bytes in the PDF file. The second parsing bug led to problems with unexpected PDF comments.

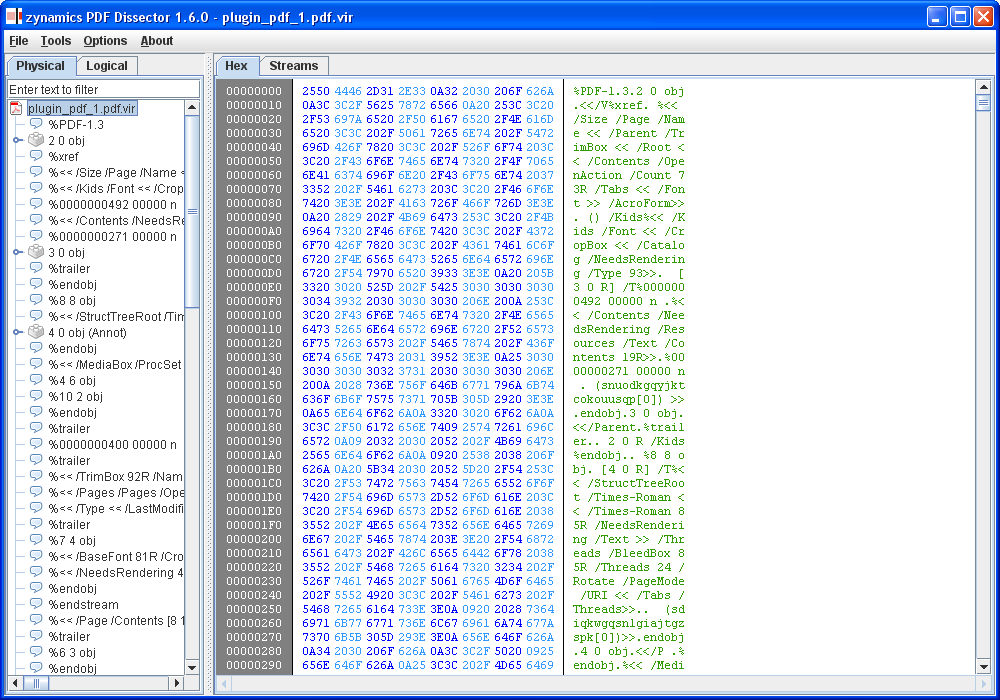
Especially that second parsing bug was very interesting. A customer sent us a PDF malware file that strategically placed PDF comment strings everywhere to confuse PDF parsers. To be able to analyze this file manually, it was also necessary to add a new feature to PDF Dissector. It is now possible to hide PDF comment strings from the PDF browsing tree. Just take a look at the two screenshots below to see why this is really useful.

Obfuscated PDF file without comment string hiding

Obfuscated PDF file with comment string hiding

To learn more about PDF Dissector, please visit the product site or the PDF Dissector manual.