We are proud to announce that BinNavi 3.0, the latest version of our graph-based reverse engineering tool, was released today. Previous versions of BinNavi have already helped reverse engineers in the IT security industry, in governmental agencies, and academia around the world do their jobs faster and better. The new version of BinNavi will definitely by very welcomed by existing and new customers because it is a huge improvement compared to BinNavi 2.2.
I have already talked about the most important new features in a previous blog post when the first beta of BinNavi 3.0 was announced. For example, I mentioned the improved exporter that is used to get information from IDA Pro into BinNavi. Back then I was excited about processing about 80.000 functions per hour. Between the first beta and the final release we managed to improve this number again. For the screenshots below I exported more than 110.000 functions in just 15 minutes. This improvement alone makes me never want to use earlier versions of BinNavi again.
Let’s take a look at a few new screenshots of BinNavi 3.0.
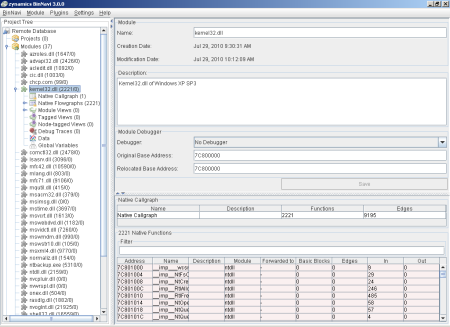
The general layout of the main window stayed the same. On the left-hand side you can configure databases to work with. In the screenshot you can see that I configured a database called Remote Database that contains 37 modules (disassembled files). These modules can then be loaded to browse through the disassembled code. The right-hand side of the main window changes depending on what node of the project tree you have selected. In the screenshot you can see detailed information for the module kernel32.dll.
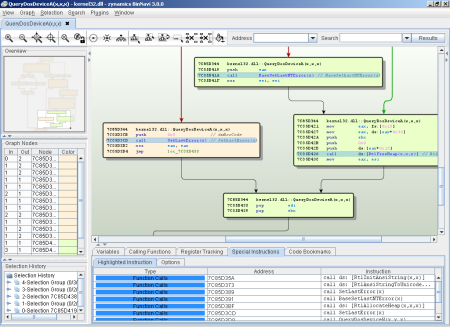
The second screenshot shows the so-called graph window where you analyze disassembled code. BinNavi always shows disassembled code as flow graphs. This makes it easier for reverse engineers to follow the control flow. In the screenshot I have changed the default color of some basic blocks and told BinNavi to highlight all function call instructions.
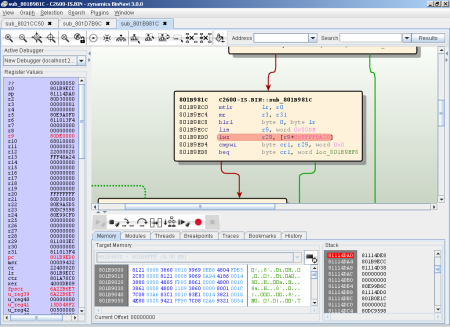
The third screenshot shows a BinNavi debugging session. The debug target is a Cisco 2600 router. The next instruction to be executed is highlighted in the graph. On the left-hand side you can see the current register values. On the bottom you can see a dump of the RAM and the current stack.
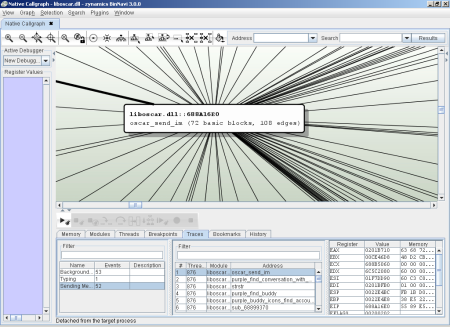
In cases when manual debugging is not enough, you can switch to trace mode. In trace mode, breakpoints are set on all nodes of the open graph and whenever a breakpoint is hit, the current register values and a small memory snapshot are recorded. This feature is so useful for quickly isolating interesting code that you should really check out the video that demonstrates this feature.
That’s it for now. If you want to learn more about BinNavi please check out the product website and the manual. If you are having any questions please leave a comment or contact the zynamics support.


Hi,
I have started using BinNavi 3.0 (amazing tool!!). I want to write my own plugins in python. I followed the sample plugin dominator_tree.py. While loading my plugin, there seems to be some errors (expected!). However, I am not able to see the errors as BinNavi says that I should check the stdout console to see the errors. Where is this stdout console? Without seeing errors, it is difficult to write any plugin. Can you please help me out?
Regards
-Sanjay