As mentioned here, one of the new features of the upcoming BinNavi 3.1 release, is the Win32 kernel debugger. This debugger enables you to perform dynamic analysis of Win32 kernel components. In this blog post I will describe how to configure your work environment to use the new debugger for BinNavi.
To debug kernel components with BinNavi, it is necessary to have a host system which runs BinNavi with the kernel debugger and a virtual machine which runs the code you want to analyse.
There are two ways for connecting your debugging system with the debugger. The first one is to use Virtual KD, which is the fastest solution, and the second one is to use the more generic, but slower WinDBG named pipe method.
It is recommended to use a virtual machine in combination with Virtual KD. Although other configurations are possible, they should only be chosen if Virtual KD can’t be used.
Configuration with Virtual KD
For this you need to install Virtual KD on the host system and on the guest vm, which will be used for debugging. After you downloaded the package and copied the target/vminstall.exe to your vm, you install Virtual KD by running the executable. Press the install button after checking if the parameters match the ones in the screenshot.
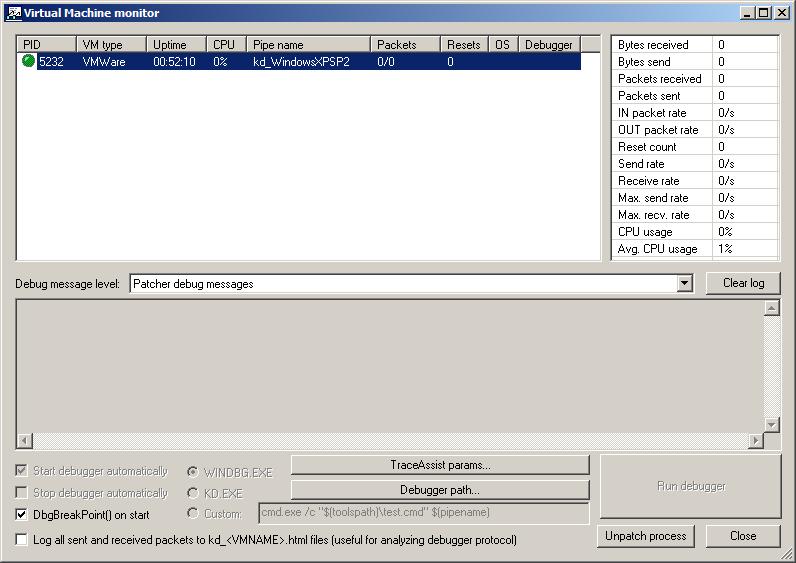
Now you can start the virtual machine monitor vmmon.exe (included in Virtual KD) on the host system and restart the debug virtual machine. The virtual machine monitor shows the pipename which is automatically created by the virtual monitor and is later used by the kernel debugger.
Configuration without Virtual KD
An alternative method is to use the standard com port via named pipes method in combination with vmware or a physical machine.
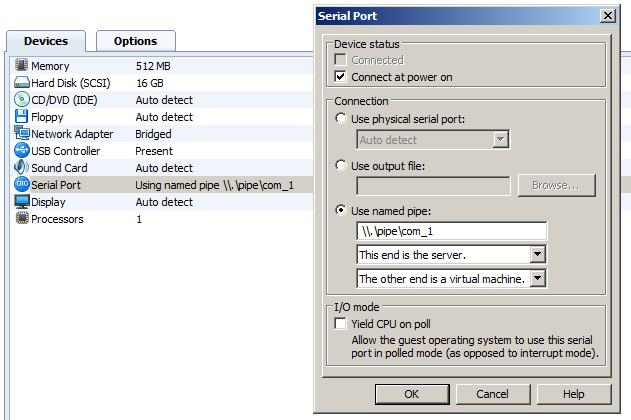
In case of using vmware, you need to go the settings of your virtual machine and add a new hardware. Choose as hardware ‘serial port’ with the name as ‘\\.\pipe\com_1’ and as additional options ‘This end is the server’ and ‘The other end is an application’.
Now you can start the virtual machine and edit the boot option to run the virtual machine with the debug option. These settings depend on your operating system:
For Windows XP:
You have to edit the boot.ini file of your virtual machine. For this you have to append the following line to your configuration file: ‘/debug /debugport=com1/baudrate=115200’.
If you want to do debug a physical machine you may want to change this parameter to suit your needs.
multi(0)disk(0)rdisk(0)partition(1)\WINDOWS="normal boot" /noexecute=optin /fastdetect

multi(0)disk(0)rdisk(0)partition(1)\WINDOWS="debug boot" /noexecute=optin /fastdetect /debug /debugport=com1 /baudrate=115200
You must reboot your vm for the changes to take effect.
For Windows Vista and Windows 7:
You have to use the bcedit command to change the boot option:
At first start a cmd shell with admin privileges, then use the following command to get the ID
bcdedit /v
then make a copy of the normal entry:
bcdedit /copy {ID} /d "kernel debug"
and enable kernel debug on it with the following command:
bcdedit /debug {ID} on
You must reboot your vm for the changes to take effect. For more information please have a look at
http://www.microsoft.com/whdc/driver/tips/Debug_Vista.mspx
Configuration in BinNavi
The next step is to load your device driver using the usual step into the BinNavi database. This procedure is explained in more detail here. After the module is successfully loaded, you have to create a new debugger and assign it to the module. The default port is 2222 which can be changed. After this is done you can run the windbg debug client using the command line:
windbgclient32.exe -p 2222 com:port=\\.\pipe\kd_WindowsXPSP2,baud=115200,pipe
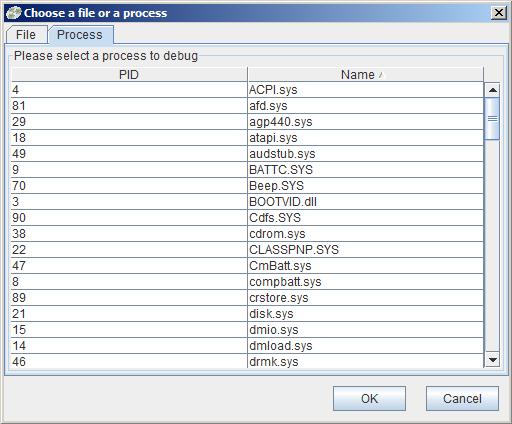
This results in listening on the default debug port and connecting to the name pipe ‘kd_WindowsXPSP2’. Now you can open the module in BinNavi by selecting a call graph or flow graph and switch to the debug view (crtl+d). To connect to the selected debugger just press the start debugger button and wait until the debugger is loaded. In the last step you have to choose the right device driver you want to debug in the dialog.
After all steps are done you can start with your normal work flow to analyse the module. This includes using the trace mode for differential debugging and setting breakpoints on interesting functions.
Happy debugging!


Win32 kernel debugger analysis easily the componenets of kernel. Nicley describe that how to configurwe Win32. Both the ways through which we could connect are described well. Configuration for different operting system all been described in well pattern. This post is really helpful who need to configure Win32 kernel.